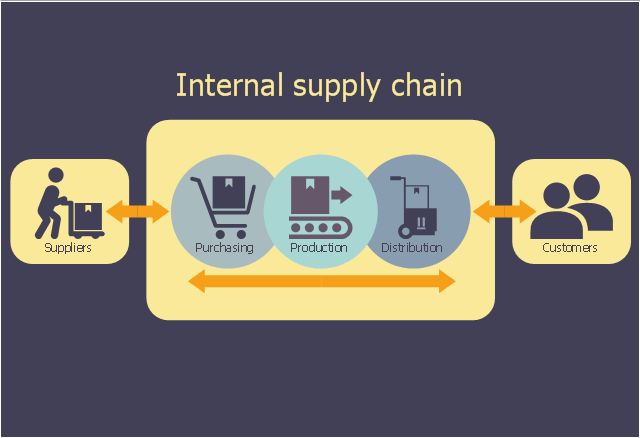
This logistic flow chart sample shows the company's supply chain. It was designed on the base of the Wikimedia Commons file: A company's supply chain (en).png. [commons.wikimedia.org/ wiki/ File:A_ company%27s_ supply_ chain_ (en).png]
This file is licensed under the Creative Commons Attribution-Share Alike 3.0 Unported license. [creativecommons.org/ licenses/ by-sa/ 3.0/ deed.en]
"A supply chain is a system of organizations, people, activities, information, and resources involved in moving a product or service from supplier to customer. Supply chain activities involve the transformation of natural resources, raw materials, and components into a finished product that is delivered to the end customer. In sophisticated supply chain systems, used products may re-enter the supply chain at any point where residual value is recyclable. Supply chains link value chains." [Supply chain. Wikipedia]
The logistic flowchart example "A company's supply chain" was created using ConceptDraw PRO diagramming and vector drawing software extended with the Logistics Flow Charts solution from the Business Processes area of ConceptDraw Solution Park.
Logistic flowchart
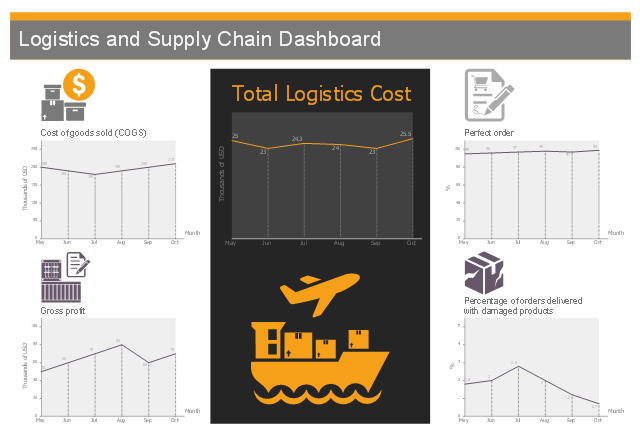
This business dashboard example shows 5 line charts of logistics and supply chain business metrics.
"A supply chain is a system of organizations, people, activities, information, and resources involved in moving a product or service from supplier to customer. Supply chain activities involve the transformation of natural resources, raw materials, and components into a finished product that is delivered to the end customer." [Supply chain. Wikipedia]
The performance dashboard example "Logistics and Supply Chain Dashboard" was designed using ConceptDraw PRO software extended with Logistic Dashboard solution from Business Processes area of ConceptDraw Solution Park.
Logistic dashboard
Software development with ConceptDraw products

Interactive Training Tool

The vector stencils library "Chemical engineering" contains 24 symbols of chemical and process engineering equipment.
Use these shapes for drawing block flow diagrams (BFD), process flow diagrams (PFD), piping and instrumentation diagrams (P&ID), and water flow diagrams.
"Chemical engineering is a branch of engineering that applies the natural (or experimental) sciences (e.g., chemistry and physics) and life sciences (e.g. biology, microbiology and biochemistry) together with mathematics and economics to production, transformation, transportation and proper usage of chemicals, materials and energy. It essentially deals with the engineering of chemicals, energy and the processes that create and/ or convert them. Modern chemical engineers are concerned with processes that convert raw-materials or (cheap)chemicals into more useful or valuable forms. In addition, they are also concerned with pioneering valuable materials and related techniques – which are often essential to related fields such as nanotechnology, fuel cells and bioengineering. Within chemical engineering, two broad subgroups include design, manufacture, and operation of plants and machinery in industrial chemical and related processes ("chemical process engineers") and development of new or adapted substances for products ranging from foods and beverages to cosmetics to cleaners to pharmaceutical ingredients, among many other products ("chemical product engineers")." [Chemical engineering. Wikipedia]
The example "Design elements - Chemical engineering" was created using the ConceptDraw PRO diagramming and vector drawing software extended with the Chemical and Process Engineering solution from the Engineering area of ConceptDraw Solution Park.
Chemical engineering symbols

 Flowcharts
The Flowcharts solution for ConceptDraw DIAGRAM is a comprehensive set of examples and samples in several varied color themes for professionals that need to represent graphically a process. Solution value is added by the basic flow chart template and shapes' libraries of flowchart notation. ConceptDraw DIAGRAM flow chart creator lets one depict the processes of any complexity and length, as well as design the Flowchart either vertically or horizontally.
How To Create Emergency Plans and Fire Evacuation

Accounting Flowchart Symbols

Best Value Stream Mapping mac Software

- Energy Pyramid Diagram | Chart Examples | U.S. energy ...
- Supply chain network | A company's supply chain | Omnichannel ...
- A company's supply chain | Groups in a supply chain cut out by ...
- Supply chain network | A company's supply chain | Groups in a ...
- Resources and energy - Vector stencils library | Energy resources ...
- Natural Resources Example
- Resources and energy - Vector stencils library | Human Resource ...
- Logistics Chart
- Matrices - Vector stencils library | Porter's value chain diagram ...
- Porter's Value Chain | Logistics Flow Charts | EPC - Business ...