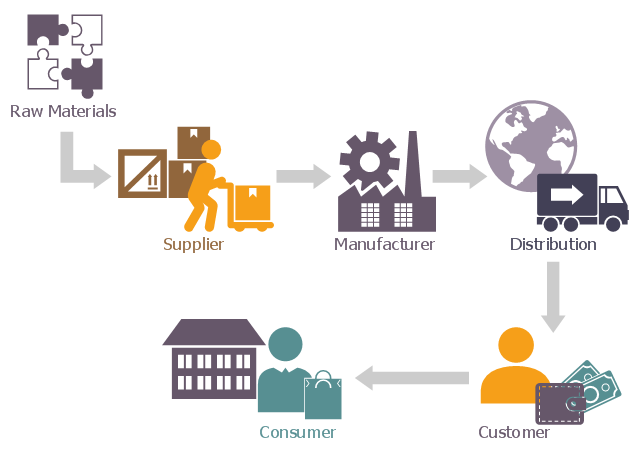
This basic diagram of supply chain network showing the movement of goods from the raw materials stage into the hands of the end consumer.
It was designed on the base of the Wikimedia Commons file: Supply chain network.png. [commons.wikimedia.org/ wiki/ File:Supply_ chain_ network.png]
This file is licensed under the Creative Commons Attribution-Share Alike 4.0 International license. [creativecommons.org/ licenses/ by-sa/ 4.0/ deed.en]
"A supply chain is a system of activities involved in handling, distributing, manufacturing and processing goods in order to move resources from a vendor into the hands of the final consumer. A supply chain is a complex network of interconnected players governed by supply and demand." [Supply chain attack. Wikipedia]
The logistic flowchart example "Supply chain network" was created using ConceptDraw PRO diagramming and vector drawing software extended with the Logistics Flow Charts solution from the Business Processes area of ConceptDraw Solution Park.
Logistic flowchart
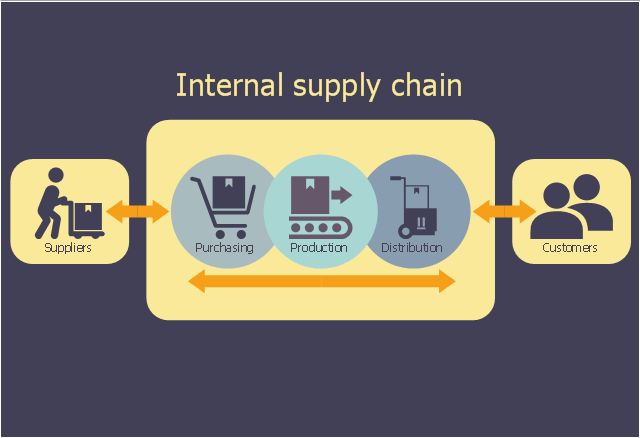
This logistic flow chart sample shows the company's supply chain. It was designed on the base of the Wikimedia Commons file: A company's supply chain (en).png. [commons.wikimedia.org/ wiki/ File:A_ company%27s_ supply_ chain_ (en).png]
This file is licensed under the Creative Commons Attribution-Share Alike 3.0 Unported license. [creativecommons.org/ licenses/ by-sa/ 3.0/ deed.en]
"A supply chain is a system of organizations, people, activities, information, and resources involved in moving a product or service from supplier to customer. Supply chain activities involve the transformation of natural resources, raw materials, and components into a finished product that is delivered to the end customer. In sophisticated supply chain systems, used products may re-enter the supply chain at any point where residual value is recyclable. Supply chains link value chains." [Supply chain. Wikipedia]
The logistic flowchart example "A company's supply chain" was created using ConceptDraw PRO diagramming and vector drawing software extended with the Logistics Flow Charts solution from the Business Processes area of ConceptDraw Solution Park.
Logistic flowchart
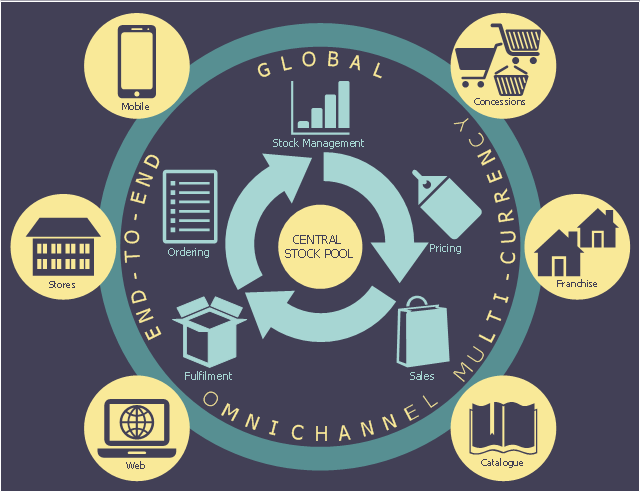
This logistic flow chart sample shows the omnichannel supply chain.
It was designed on the base of the Wikimedia Commons file: Merret-grey.jpeg. [commons.wikimedia.org/ wiki/ File:Merret-grey.jpeg]
This file is licensed under the Creative Commons Attribution-Share Alike 4.0 International license. [creativecommons.org/ licenses/ by-sa/ 4.0/ deed.en]
"An omnichannel supply chain uses a central stock pool to control a number of factors such as pricing, fulfilment, sales, stock management and ordering. These orders are fulfilled from numerous retail channels such as concessions, franchises, catalogue, web, stores and mobile. The central stock pool is the heart of all these operations. The supply chain is now on the front line thanks to omnichannel. Consumers are increasingly demanding in this day and age, expecting to be able to browse, buy and return goods through various channels and not just the traditional in-store way. This requires real-time, channel-agnostic visibility of inventory across the supply chain and a single view of the consumer as they hop from one channel to another." [Omnichannel Supply Chain. Wikipedia]
The logistic flowchart example "Omnichannel supply chain" was created using ConceptDraw PRO diagramming and vector drawing software extended with the Logistics Flow Charts solution from the Business Processes area of ConceptDraw Solution Park.
Logistic flowchart
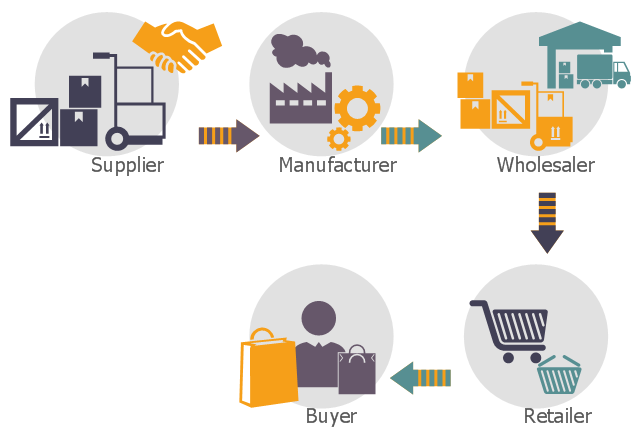
This logistic flow chart sample shows the groups in a supply chain cut out by disintermediation.
It was designed on the base of the Wikimedia Commons file: Disintermediation graphic.PNG. [commons.wikimedia.org/ wiki/ File:Disintermediation_ graphic.PNG]
This file is licensed under the Creative Commons Attribution-Share Alike 3.0 Unported license. [creativecommons.org/ licenses/ by-sa/ 3.0/ deed.en]
"In economics, disintermediation is the removal of intermediaries from a supply chain, or "cutting out the middlemen" in connection with a transaction or a series of transactions. Instead of going through traditional distribution channels, which had some type of intermediary (such as a distributor, wholesaler, broker, or agent), companies may now deal with customers directly, for example via the Internet." [Disintermediation. Wikipedia]
The logistic flowchart example "Groups in a supply chain cut out by disintermediation" was created using ConceptDraw PRO diagramming and vector drawing software extended with the Logistics Flow Charts solution from the Business Processes area of ConceptDraw Solution Park.
Logistic flowchart
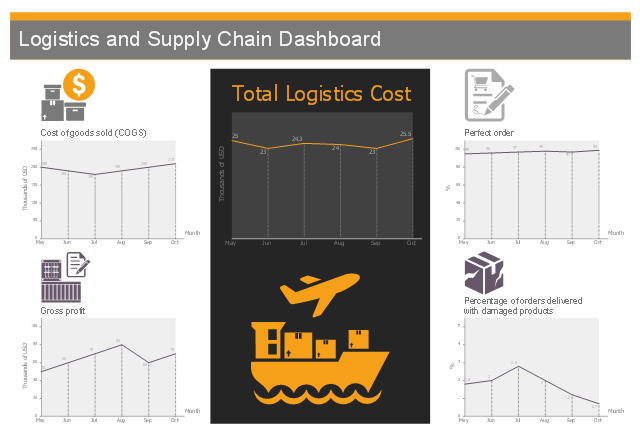
This business dashboard template contains 5 line charts of logistics and supply chain business metrics.
Use it to create your logistic and supply chain dashboard with ConceptDraw PRO software.
The performance dashboard template "Logistics and Supply Chain Dashboard" is included in Logistic Dashboard solution from Business Processes area of ConceptDraw Solution Park.
Use it to create your logistic and supply chain dashboard with ConceptDraw PRO software.
The performance dashboard template "Logistics and Supply Chain Dashboard" is included in Logistic Dashboard solution from Business Processes area of ConceptDraw Solution Park.
Logistic dashboard
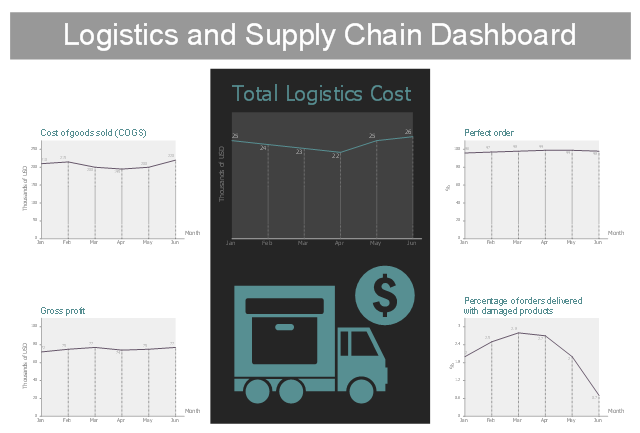
This business dashboard example shows 5 line charts of logistics and supply chain business metrics.
"A supply chain is a system of organizations, people, activities, information, and resources involved in moving a product or service from supplier to customer. Supply chain activities involve the transformation of natural resources, raw materials, and components into a finished product that is delivered to the end customer." [Supply chain. Wikipedia]
The performance dashboard example "Logistics and Supply Chain Dashboard" was designed using ConceptDraw PRO software extended with Logistic Dashboard solution from Business Processes area of ConceptDraw Solution Park.
Logistic dashboard
 Logistics Flow Charts
Logistics Flow Charts solution extends ConceptDraw PRO v11 functionality with opportunities of powerful logistics management software. It provides large collection of predesigned vector logistic symbols, pictograms, objects and clipart to help you design with pleasure Logistics flow chart, Logistics process flow diagram, Inventory flow chart, Warehouse flowchart, Warehouse management flow chart, Inventory control flowchart, or any other Logistics diagram. Use this solution for logistics planning, to reflect logistics activities and processes of an enterprise or firm, to depict the company's supply chains, to demonstrate the ways of enhancing the economic stability on the market, to realize logistics reforms and effective products' promotion.
Best Value Stream Mapping mac Software
 diagram")
Total Quality Management Definition

HelpDesk
How to Make a Logistic Dashboard

 Logistic Dashboard
The powerful tools of Logistic Dashboard solution and specially developed live graphic objects of logistic icons, logistic navigation elements, logistic indicators, logistic charts and logistic maps effectively assist in designing Logistic dashboards, Logistic maps, Logistic charts, diagrams and infographics. The included set of prebuilt samples and quick-start templates, demonstrates the power of ConceptDraw PRO software in logistics management, its assisting abilities in development, realization and analyzing the logistic processes, as well as in perfection the methods of logistics management.
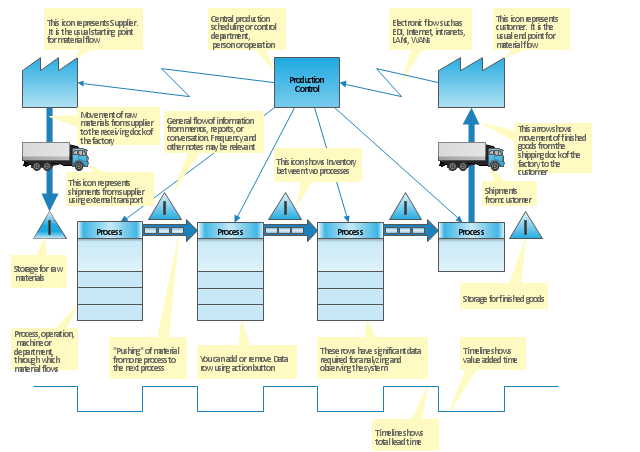
"Value stream mapping is a lean management principle used to analyze and design the flow of materials and information required to bring a product or service to a consumer. Pioneered by Henry Ford in the 1920s, perfected by Toyota. At Toyota, it is known as "material and information flow mapping". It can be applied to nearly any value chain. ...
Value stream mapping has supporting methods that are often used in Lean environments to analyze and design flows at the system level (across multiple processes).
Although value stream mapping is often associated with manufacturing, it is also used in logistics, supply chain, service related industries, healthcare, software development, product development, and administrative and office processes." [Value stream mapping. Wikipedia]
This value stream map template explains the meanings of the VSM design elements.
This Value stream map template for the ConceptDraw PRO diagramming and vector drawing software is included in the Value Stream Mapping solution from the Quality area of ConceptDraw Solution Park.
VSM template
- Supply Chain Order Process Flow Chart Template
- Supply Chain Process Flow Chart Templates
- Logistics Flow Charts | Process Flowchart | Supply chain network ...
- Visio Stencils Supply Chain
- Supply Chain Process Flow Diagram
- Supply Chain Business Process Flow Diagram
- Supply Chain Flow Chart Template
- Supply Chain Mapping Template Excel
- Supply Chain Map Template
- Supply Chain Diagram Maker
- Visio Supply Chain Examples
- Process Flowchart | Dhl Supply Chain Diagram
- Process Supply Chain Management Flow Chart
- Diagram Of Internal Supply Chain
- Plumbing and Piping Plans | Draw Washing Machine Supply Chain ...
- Logistics Flow Charts | Personalized Bag Sample Supply Chain ...
- Excel Supply Chain Template
- Supply Chain Symbols Flowchart In Visio
- Supply Chain Clipart
- Supply Chain Diagram Process