Product Overview

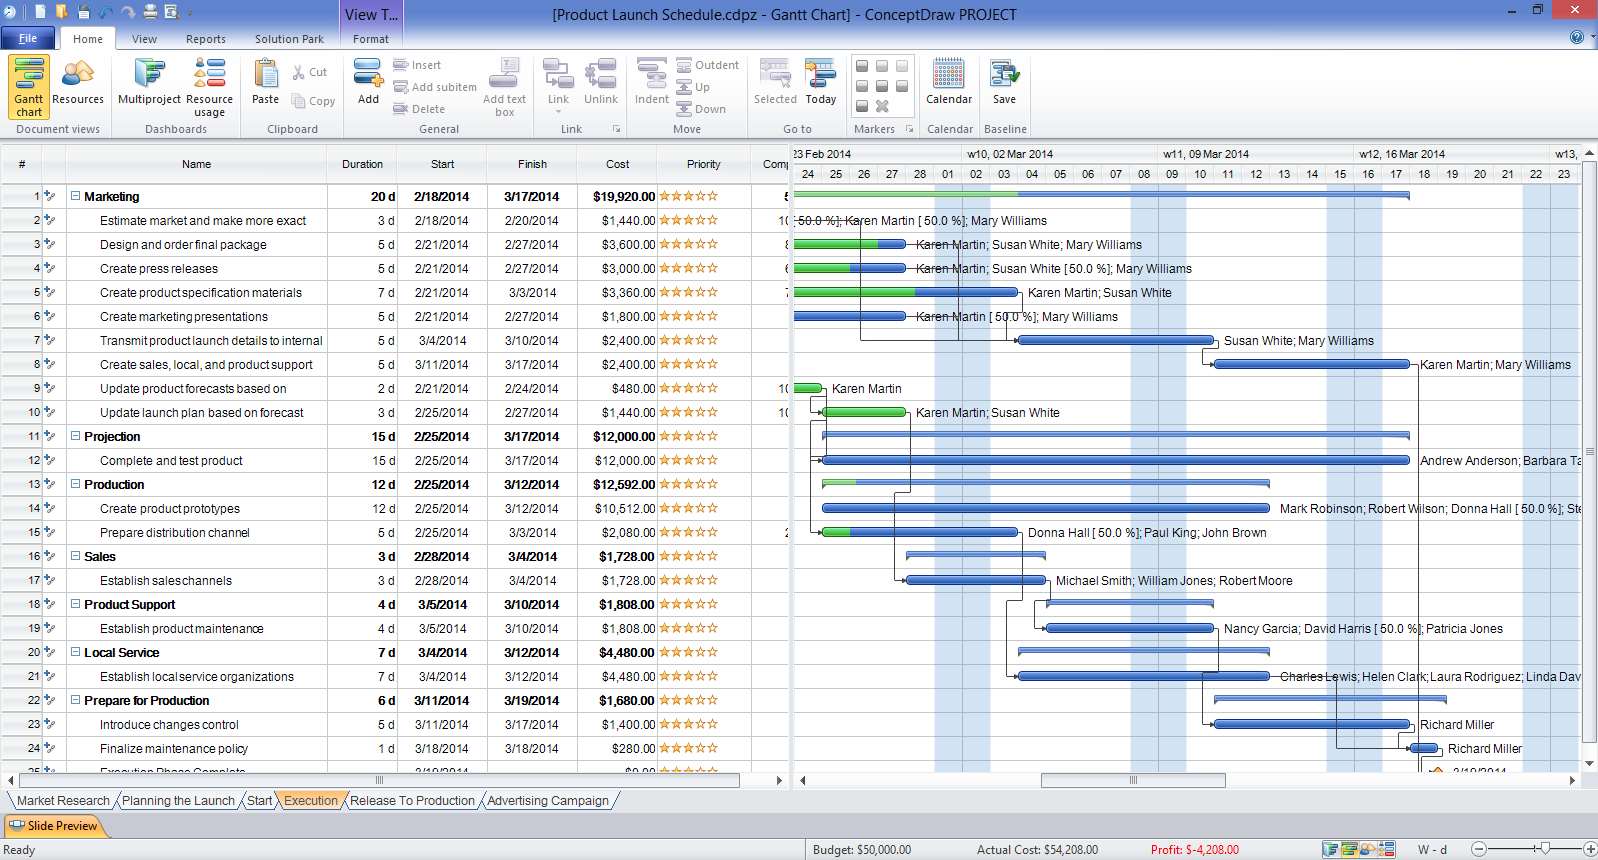
Gantt Chart Software
HelpDesk
How to Shift Dates in ConceptDraw PROJECT

Examples of Flowcharts, Org Charts and More


Gant Chart in Project Management


HelpDesk
How to Track Your Project Plan vs. the Actual Project Condition

Gantt chart examples

Critical Path Method in ConceptDraw PROJECT

ConceptDraw PROJECT Software Overview

- Project — Working With Costs | How to Create Multiple Projects ...
- Timeline Examples | Project Timeline | How to Make a Timeline ...
- Multiple Project Gantt Chart Template
- How to Create a Timeline Diagram in ConceptDraw PRO | Project ...
- Project Timeline | Timeline Diagrams | Timeline Examples | Timeline ...
- How to Report on Multiple Projects Status | PM Dashboards | Project ...
- Project Timeline Stakeholders
- Project Management Calendar Template
- How to Create Multiple Projects Schedule on OS X | How to Create ...