This site uses cookies. By continuing to browse the ConceptDraw site you are agreeing to our Use of Site Cookies.
HelpDesk

How to Add a Concept Map to a PowerPoint Presentation

Concept maps visually present the relationships among a set of logically connected items. ConceptDraw DIAGRAM allows you to draw concept maps using the Concept Map solution. The PowerPoint presentation of key concept points can be very informative and helpful.

Stakeholder Onion Diagram Template

For depicting the onion model are actively used Stakeholder Onion Diagrams. The ConceptDraw DIAGRAM diagramming and vector drawing software extended with Stakeholder Onion Diagrams Solution from the Management Area of ConceptDraw Solution Park offers the number of useful tools and Stakeholder Onion Diagram template for their easy design.

Process Flow Chart

A Process Flow Chart is a type of flowchart which is mostly used in industrial, chemical and process engineering for illustrating high-level processes, major plant processes and not shows minor details.
ConceptDraw DIAGRAM diagramming and vector drawing software extended with Flowcharts Solution from the "Diagrams" Area of ConceptDraw Solution Park is the best way to create Process Flow Chart and other types of flowcharts.

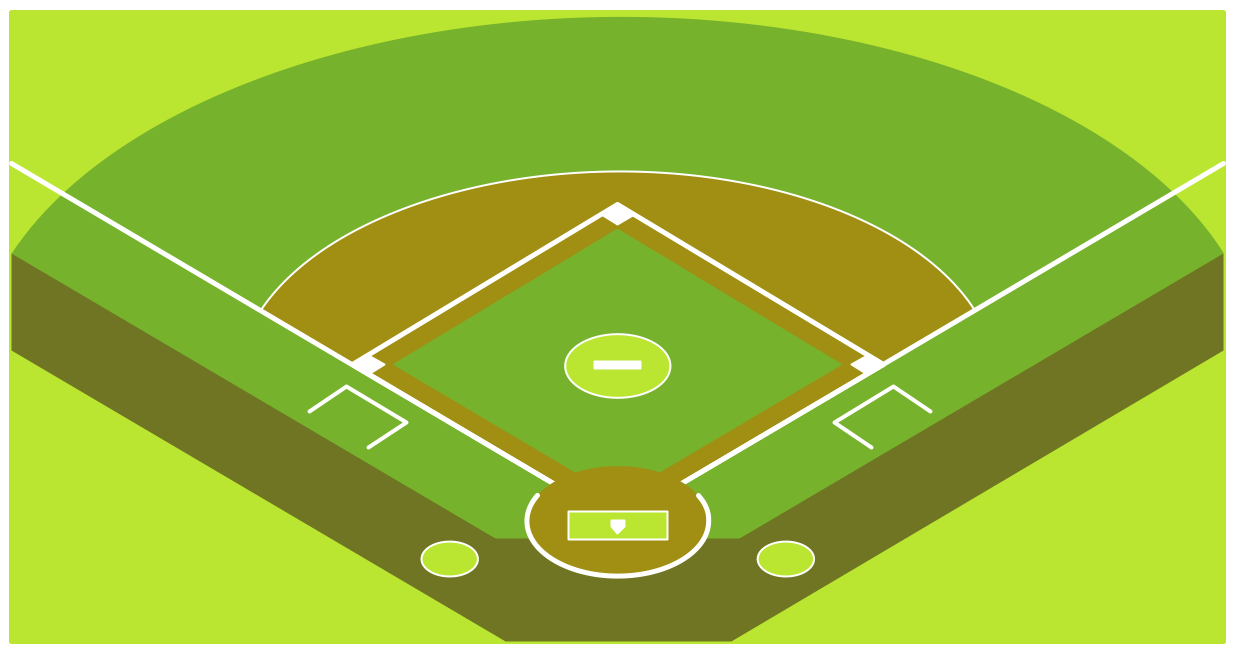
Baseball Diagram – Baseball Field – Corner View – Template

ConceptDraw DIAGRAM extended with the Baseball solution provides access to libraries, templates and samples allows creating baseball diagrams and schemas. Fields objects are designed according to real fields dimensions. A set of fields samples includes dimensions. All plays and positions diagrams are available as ready-to-modify samples.

Matrix Organization Structure

Matrix organizational structure is one of the main forms of structures which is actively used by organizations to carry forth the functions of a company visually and effectively.
Now we have ConceptDraw DIAGRAM diagramming and vector drawing software extended with 25 Typical Orgcharts solution from the Management area of ConceptDraw Solution Park which will help easy represent matrix organizational structure of any degree of complexity.

Context Diagram Template

This template shows the Context Diagram. It was created in ConceptDraw DIAGRAM diagramming and vector drawing software using the Block Diagrams Solution from the “Diagrams” area of ConceptDraw Solution Park.
The context diagram graphically identifies the system. external factors, and relations between them. It’s a high level view of the system. The context diagrams are widely used in software engineering and systems engineering for designing the systems that process the information.

Cloud Computing Architecture Diagrams

For documenting the Cloud Computing Architecture with a goal to facilitate the communication between stakeholders are successfully used the Cloud Computing Architecture diagrams. It is convenient and easy to draw various Cloud Computing Architecture diagrams in ConceptDraw DIAGRAM software with help of tools of the Cloud Computing Diagrams Solution from the Computer and Networks Area of ConceptDraw Solution Park.

enterprise architecture diagram, business architecture Enterprise Architecture Diagrams

enterprise architecture diagram, business architecture
Enterprise Architecture Diagrams solution extends ConceptDraw DIAGRAM software with templates, samples and library of vector stencils for drawing the diagrams of enterprise architecture models.

Organizational Chart Templates

ConceptDraw offers you a number of ready-made organizational chart templates which you can use in your drawing. They are grouped in topical sets as organizational chart template files.
Use the Organizational Charts Solution for ConceptDraw DIAGRAM to create your own Organizational Charts of any complexity quick, easy and effective.
The Organizational Charts designed with ConceptDraw DIAGRAM are vector graphic documents and are available for reviewing, modifying, converting to a variety of formats (image, HTML, PDF file, MS PowerPoint Presentation, Adobe Flash or MS Visio XML), printing and send via e-mail in one moment.
How to draw an Organizational Chart
HelpDesk

How to Add a Cross-Functional Flowchart to a PowerPoint Presentation

Using a Cross-Functional flowchart is a clear way of showing how business processes get shared or transferred between different teams and departments. ConceptDraw DIAGRAM allows you to make an MS PowerPoint Presentation from your flowcharts in a few simple steps.