How to Discover Critical Path on a Gantt Chart
ConceptDraw PROJECT is the Gantt chart software that implements critical path method to provide the user with a wide set of project management tools.Project — Working With Costs
ConceptDraw PROJECT delivers a rich set of built-in functionalities and optional product extensions that support your daily workflow in time-saving and creative ways. This video lesson will teach you how to work with costs in your project document.Remote Projects in Corporate Strategy
Communication is the main challenge and the key success factor for organizational project management in company with remote projects. Communicating visually via Skype you bring all projects together to achieve corporate goals.
How to Create Presentation of Your Project Gantt Chart
During the planning, discussing and execution of a project you may need to prepare a presentation using project views such as the Gantt Chart, Multiproject Dashboard or Resource Usage View. It’s easy do with ConceptDraw PROJECT!Waterfall Bar Chart
Waterfall chart shows the changing of the value from one state to another through the series of intermediate changes. The waterfall diagrams are widely used in the business. They are used to represent the set of figures and allow link the individual values to the whole.What is Gantt Chart (historical reference)
Historical reference about the Gantt chart.How to Create Gantt Chart
To begin managing a new project, you will need to define the individual Tasks that must be completed to deliver it. The default view for a new project in ConceptDraw PROJECT is the Gantt Chart.HelpDesk
How to Generate ConceptDraw PROJECT Standard Reports on Mac
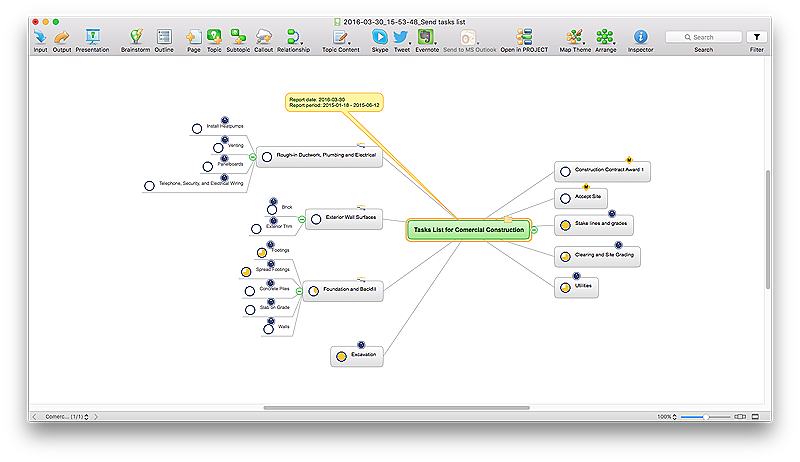
Project reporting is one of the key functions of effective project management. Using regular project reports, project manager can constantly track and analyze the project’s execution. This analytic process can help to ensure that the team reaches the best possible solutions. ConceptDraw PROJECT is a professional software tool for project management with the advanced mechanism of reporting. You can create the set of regular reports on project activities, task statuses, cash flow and assignments in MS Excel format. Mind map reports are also available.Gantt chart examples
All Gantt charts were made using ConceptDraw PROJECT. ConceptDraw PROJECT works both on Windows and Mac OS X. It allows to schedule a voluntary number of projects in a single Workspace document and lets easily share tasks and resources among them. ConceptDraw PROJECT shares files among Windows and Mac OS X.HelpDesk
How to Draw a Gantt Chart Using ConceptDraw PRO
A Gantt chart is intended to provide a visualization of a project schedule. It is developed to help planning, coordinating, and tracking on project tasks implementation. One of the most critical resources for a project implementation is a time resources. Gantt chart - is one of the most convenient and popular way of graphical representation of a project tasks progress in conjunction with the corresponding time consumption. Gantt chart's function is to show project tasks completion in a progress, and to make a project manager sure that project tasks were completed on time. ConceptDraw Office is a clear and easy-to-use tool for project management. It is a very handy visual tool that helps make a project processing clear.- 5s Diagram Mind Map
- Top 5 Android Flow Chart Apps | How to Create a Timeline Diagram ...
- Top 5 Android Flow Chart Apps | Gantt charts for planning and ...
- How to Make a Mind Map from a Project Gantt Chart | Top 5 Android ...
- Business Process Mapping | Graphic User Interface | Management 5s
- How to Create Flowchart Using Standard Flowchart Symbols | Top 5 ...
- Gantt Chart 5s
- How to Make a Mind Map from a Project Gantt Chart | How to Create ...
- Flow chart Example. Warehouse Flowchart | Top 5 Android Flow ...
- How to Create Presentation of Your Project Gantt Chart ...


