Sales Performance
Data Visualization Solutions

Reporting & Data Visualization

Ways You Can Visualize Sales Data
Data Visualization Software Solutions

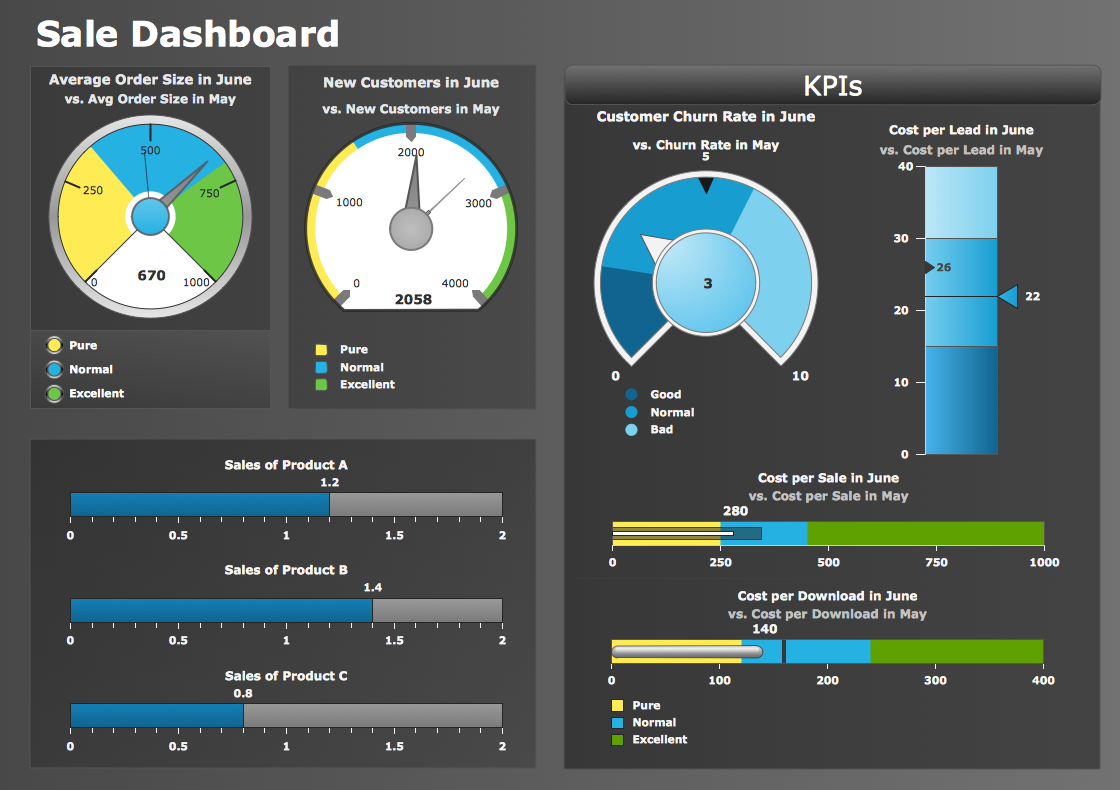
 Meter Dashboard
Meter dashboard solution extends ConceptDraw DIAGRAM software with templates, samples and vector stencils library with meter indicators for drawing visual dashboards showing quantitative data.
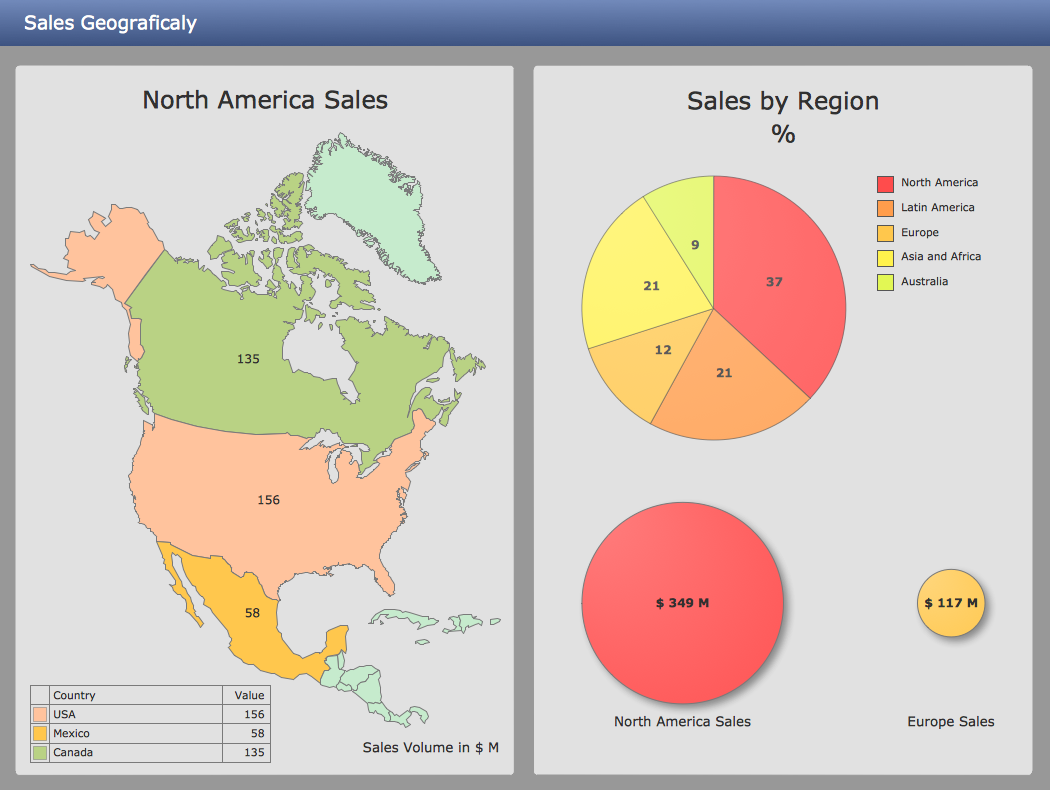
Visualize Sales Data Using Sample Data

Sales Dashboards for Your Company

 Seven Basic Tools of Quality
Manage quality control in the workplace, using fishbone diagrams, flowcharts, Pareto charts and histograms, provided by the Seven Basic Tools of Quality solution.
- Customer Relationship Management | Data Visualization Software ...
- The Facts and KPIs | Dashboard | Reporting & Data Visualization ...
- Data Visualization Software Solutions | Sales Dashboard Template ...
- Meter Dashboard | What is a Dashboard Area | Sale dashboard ...
- KPIs and Metrics | Visualize Sales Data Using Sample Data | Sales ...
- Sales Dashboard Template | Business Intelligence Dashboard ...
- Sales Dashboard Template | Sales Dashboard Examples | Meter ...
- Meter Dashboard | Status Dashboard | KPIs and Metrics | Dash ...
- Sales Performance | Data Visualization Solutions | Visualization ...
- Sales Process Flowchart. Flowchart Examples | Sales Dashboards ...