Process Flow Diagram Symbols

HelpDesk
How to Draw a Chemical Process Flow Diagram

Electrical Symbols, Electrical Diagram Symbols

 Seven Basic Tools of Quality
Manage quality control in the workplace, using fishbone diagrams, flowcharts, Pareto charts and histograms, provided by the Seven Basic Tools of Quality solution.
Flow chart Example. Warehouse Flowchart


 Chemical and Process Engineering
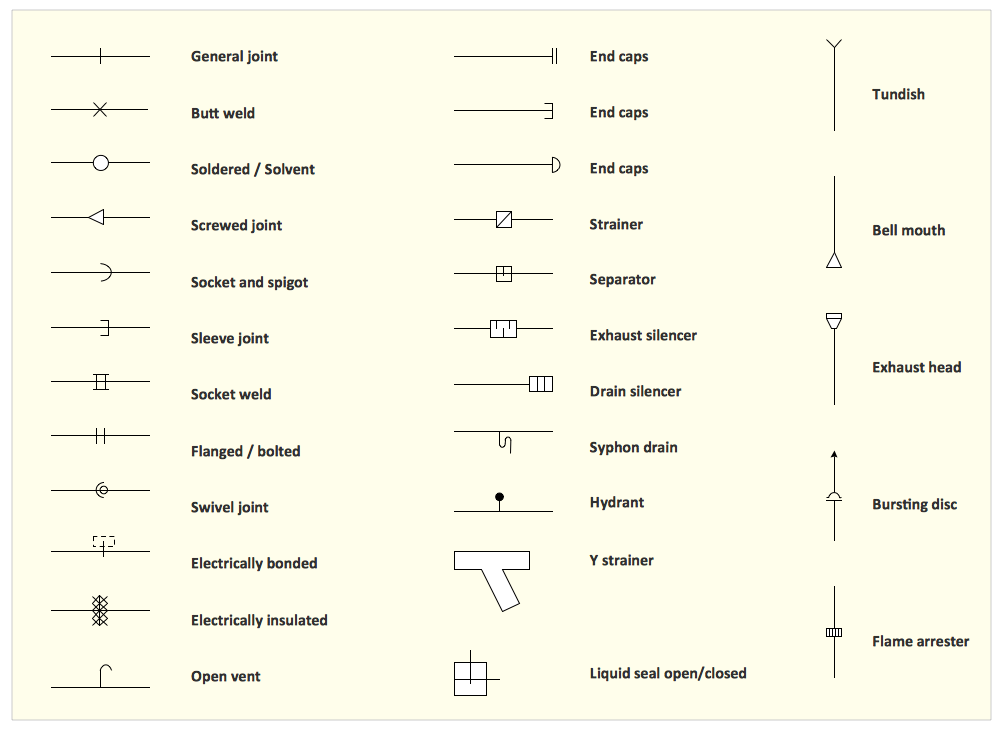
This chemical engineering solution extends ConceptDraw DIAGRAM.9.5 (or later) with process flow diagram symbols, samples, process diagrams templates and libraries of design elements for creating process and instrumentation diagrams, block flow diagrams (BFD
"A process flow diagram (PFD) is a diagram commonly used in chemical and process engineering to indicate the general flow of plant processes and equipment. The PFD displays the relationship between major equipment of a plant facility and does not show minor details such as piping details and designations. Another commonly used term for a PFD is a flowsheet. ...
Process flow diagrams of multiple process units within a large industrial plant will usually contain less detail and may be called block flow diagrams or schematic flow diagrams." [Process flow diagram. Wikipedia]
The process flow diagram (PFD) template for the ConceptDraw PRO diagramming and vector drawing software is included in the Chemical and Process Engineering solution from the Engineering area of ConceptDraw Solution Park.
Process flow diagram (PFD) template
-template-process-flow-diagram-(pfd)-template.png--diagram-flowchart-example.png)
Interior Design. Piping Plan — Design Elements
 Fishbone Diagrams
The Fishbone Diagrams solution extends ConceptDraw DIAGRAM software with the ability to easily draw the Fishbone Diagrams (Ishikawa Diagrams) to clearly see the cause and effect analysis and also problem solving. The vector graphic diagrams produced using this solution can be used in whitepapers, presentations, datasheets, posters, and published technical material.
, t chart, decision matrix, decision tree analysis") Decision Making
Decision Making
The Decision Making solution offers the set of professionally developed examples, powerful drawing tools and a wide range of libraries with specific ready-made vector decision icons, decision pictograms, decision flowchart elements, decision tree icons, decision signs arrows, and callouts, allowing the decision maker (even without drawing and design skills) to easily construct Decision diagrams, Business decision maps, Decision flowcharts, Decision trees, Decision matrix, T Chart, Influence diagrams, which are powerful in questions of decision making, holding decision tree analysis and Analytic Hierarchy Process (AHP), visual decomposition the decision problem into hierarchy of easily comprehensible sub-problems and solving them without any efforts.
- Process Flow Diagram Symbols | How to Create a Mechanical ...
- Flow Diagram In Industrial Engineering
- Flow Diagram Of Pump
- Official Symbols Used In Chemical Industries
- Technical Drawing Software | Process Flow Diagram Symbols ...
- Oil And Gas Process Flow Diagram
- Process Flow Diagram Symbols | Chemical Engineering | Technical ...
- How to Draw a Chemical Process Flow Diagram | Chemical and ...
- Process Flowchart | Chemical and Process Engineering | Flow ...
- Process Flowchart | Process Engineering | Process Flow Diagram ...