This cloud computing diagram example was drawn on the base of Wikimedia Commons file: Principal cloud manufacturing.png. [commons.wikimedia.org/ wiki/ File:Principal_ cloud_ manufacturing.png]
This file is licensed under the Creative Commons Attribution-Share Alike 3.0 Unported license. [creativecommons.org/ licenses/ by-sa/ 3.0/ deed.en]
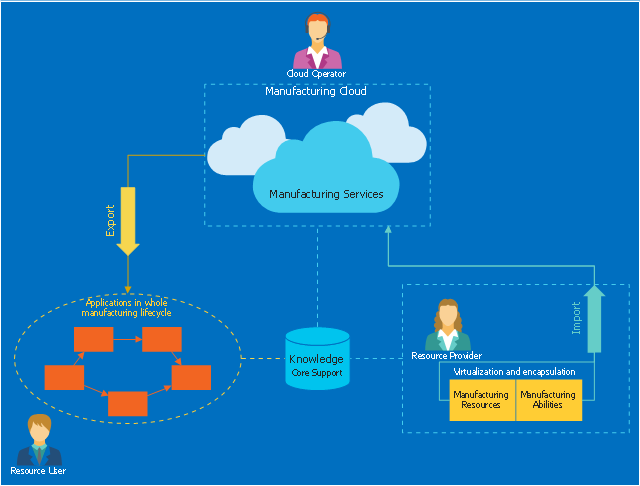
"Cloud manufacturing (CMfg) is a new manufacturing paradigm developed from existing advanced manufacturing models (e.g., ASP, AM, NM, MGrid) and enterprise information technologies under the support of cloud computing, Internet of Things (IoT), virtualization and service-oriented technologies, and advanced computing technologies. It transforms manufacturing resources and manufacturing capabilities into manufacturing services, which can be managed and operated in an intelligent and unified way to enable the full sharing and circulating of manufacturing resources and manufacturing capabilities. CMfg can provide safe and reliable, high quality, cheap and on-demand manufacturing services for the whole lifecycle of manufacturing." [Cloud manufacturing. Wikipedia]
The cloud computing diagram example "Principal cloud manufacturing" was drawn using ConceptDraw PRO software extended with the Cloud Computing Diagrams solution from the Computer and Networks area of ConceptDraw Solution Park.
This file is licensed under the Creative Commons Attribution-Share Alike 3.0 Unported license. [creativecommons.org/ licenses/ by-sa/ 3.0/ deed.en]
"Cloud manufacturing (CMfg) is a new manufacturing paradigm developed from existing advanced manufacturing models (e.g., ASP, AM, NM, MGrid) and enterprise information technologies under the support of cloud computing, Internet of Things (IoT), virtualization and service-oriented technologies, and advanced computing technologies. It transforms manufacturing resources and manufacturing capabilities into manufacturing services, which can be managed and operated in an intelligent and unified way to enable the full sharing and circulating of manufacturing resources and manufacturing capabilities. CMfg can provide safe and reliable, high quality, cheap and on-demand manufacturing services for the whole lifecycle of manufacturing." [Cloud manufacturing. Wikipedia]
The cloud computing diagram example "Principal cloud manufacturing" was drawn using ConceptDraw PRO software extended with the Cloud Computing Diagrams solution from the Computer and Networks area of ConceptDraw Solution Park.
Cloud computing diagram example
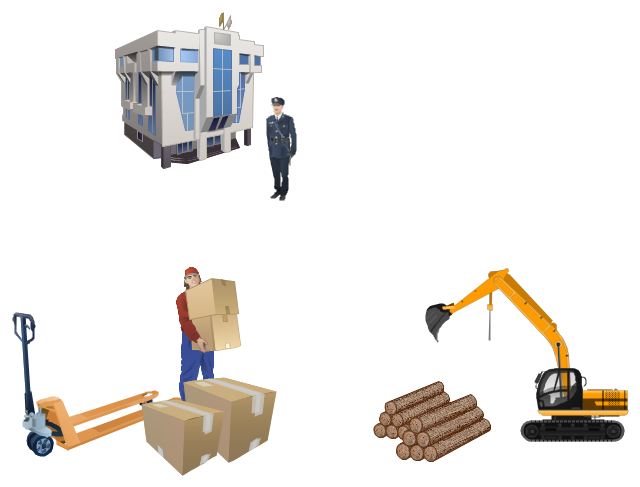
 Manufacturing and Maintenance
Manufacturing and maintenance solution extends ConceptDraw DIAGRAM software with illustration samples, templates and vector stencils libraries with clip art of packaging systems, industrial vehicles, tools, resources and energy.
How to Build Cloud Computing Diagram Principal Cloud Manufacturing

"Consumption of energy resources, (e.g. turning on a light) requires resources and has an effect on the environment. Many electric power plants burn coal, oil or natural gas in order to generate electricity for energy needs. While burning these fossil fuels produces a readily available and instantaneous supply of electricity, it also generates air pollutants including carbon dioxide (CO2), sulfur dioxide and trioxide (SOx) and nitrogen oxides (NOx). Carbon dioxide is an important greenhouse gas which is thought to be responsible for some fraction of the rapid increase in global warming seen especially in the temperature records in the 20th century, as compared with tens of thousands of years worth of temperature records which can be read from ice cores taken in Arctic regions. Burning fossil fuels for electricity generation also releases trace metals such as beryllium, cadmium, chromium, copper, manganese, mercury, nickel, and silver into the environment, which also act as pollutants.
The large-scale use of renewable energy technologies would "greatly mitigate or eliminate a wide range of environmental and human health impacts of energy use". Renewable energy technologies include biofuels, solar heating and cooling, hydroelectric power, solar power, and wind power. Energy conservation and the efficient use of energy would also help." [Energy industry. Environmental impact. Wikipedia]
The Energy resources diagram example was created in the ConceptDraw PRO diagramming and vector drawing software using the Manufacturing and Maintenance solution from the Illustration area of ConceptDraw Solution Park.
Infographics

Value stream with ConceptDraw DIAGRAM

Project — Assigning Resources


SWOT Analysis

The vector illustration template "Manufacturing and Maintenance" opens the libraries of vector clipart: Packaging, loading, customs; Industrial vehicles; Tools; Resources and energy.
The vector illustration template "Manufacturing and Maintenance" for the ConceptDraw PRO diagramming and vector drawing software is included in the Manufacturing and Maintenance solution from the Illustration area of ConceptDraw Solution Park.
The vector illustration template "Manufacturing and Maintenance" for the ConceptDraw PRO diagramming and vector drawing software is included in the Manufacturing and Maintenance solution from the Illustration area of ConceptDraw Solution Park.
Vector illustration
The vector stencils library "Resources and energy" contains 19 clipart images for drawing illustrations on resources and energy.
"Natural resources occur naturally within environments that exist relatively undisturbed by humanity, in a natural form. A natural resource is often characterized by amounts of biodiversity and geodiversity existent in various ecosystems.
Natural resources are derived from the environment. Some of them are essential for our survival while most are used for satisfying our wants. Natural resources may be further classified in different ways.
Natural resources are materials and components (something that can be used) that can be found within the environment. Every man-made product is composed of natural resources (at its fundamental level). A natural resource may exist as a separate entity such as fresh water, and air, as well as a living organism such as a fish, or it may exist in an alternate form which must be processed to obtain the resource such as metal ores, oil, and most forms of energy." [Natural resource. Wikipedia]
The clip art example "Resources and energy - Vector stencils library" was created in ConceptDraw PRO diagramming and vector drawing software using the Manufacturing and Maintenance solution from the Illustration area of ConceptDraw Solution Park.
Human resources

Batteries

Wind turbine

Transmission tower

Natural gas burner

Solar panel

Lightning

Ionizing radiation hazard sign

High voltage symbol

Atom

Incandescent light bulb

Oil barrels

Power station

Wood

Perpetuum mobile

Hydroelectric dam

Liquefied petroleum gas

Natural gas

Minecart with coal

Flowchart Symbols Accounting. Activity-based costing (ABC) flowchart

- Energy resources diagram | Manufacturing and Maintenance | Life ...
- Pie Charts | Energy resources diagram | Manufacturing and ...
- Energy resources diagram | Manufacturing and Maintenance ...
- Manufacturing and Maintenance | Renewable Resources Clipart
- Energy resources diagram | Manufacturing and Maintenance | Pie ...
- Manufacturing and Maintenance | Diagram Of Renewable And ...
- Manufacturing and Maintenance | Resources and energy - Vector ...
- Energy resources diagram | Pie Charts | Manufacturing and ...
- Vector Map of Germany | Manufacturing and Maintenance | Energy ...
- Manufacturing and Maintenance | Chart Diagram Of Renewable And ...