 Manufacturing and Maintenance
Manufacturing and maintenance solution extends ConceptDraw DIAGRAM software with illustration samples, templates and vector stencils libraries with clip art of packaging systems, industrial vehicles, tools, resources and energy.
Entity Relationship Diagram Examples


Local area network (LAN). Computer and Network Examples
 diagram")

How Do Fishbone Diagrams Solve Manufacturing Problems

 Pie Charts
Pie Charts are extensively used in statistics and business for explaining data and work results, in mass media for comparison (i.e. to visualize the percentage for the parts of one total), and in many other fields. The Pie Charts solution for ConceptDraw DIAGRAM offers powerful drawing tools, varied templates, samples, and a library of vector stencils for simple construction and design of Pie Charts, Donut Chart, and Pie Graph Worksheets.
Chore charts with ConceptDraw DIAGRAM

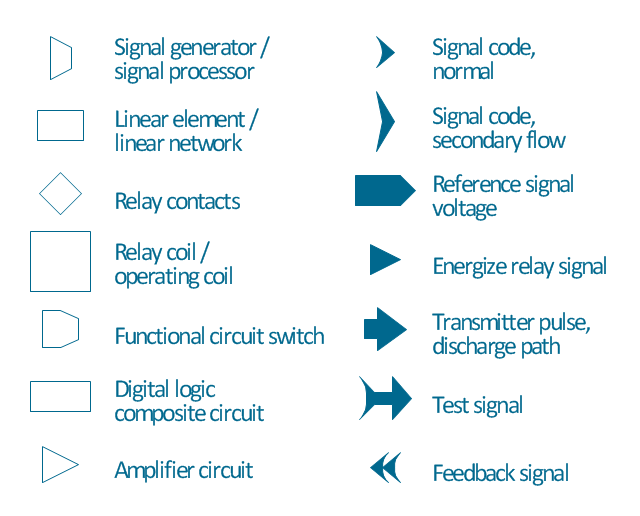
The vector stencils library "Maintenance" contains 14 symbols for maintaining electrical and electronic systems, including test, feedback and reference signals; pulses; relay contacts and coils; and composite and amplifier circuits.
The symbols example "Design elements - Maintenance" was drawn using the ConceptDraw PRO diagramming and vector drawing software extended with the Electrical Engineering solution from the Engineering area of ConceptDraw Solution Park.
The symbols example "Design elements - Maintenance" was drawn using the ConceptDraw PRO diagramming and vector drawing software extended with the Electrical Engineering solution from the Engineering area of ConceptDraw Solution Park.
Maintenance symbols
Hybrid Network Topology

 Logistics Flow Charts
Logistics Flow Charts solution extends ConceptDraw DIAGRAM functionality with opportunities of powerful logistics management software. It provides large collection of predesigned vector logistic symbols, pictograms, objects and clipart to help you design with pleasure Logistics flow chart, Logistics process flow diagram, Inventory flow chart, Warehouse flowchart, Warehouse management flow chart, Inventory control flowchart, or any other Logistics diagram. Use this solution for logistics planning, to reflect logistics activities and processes of an enterprise or firm, to depict the company's supply chains, to demonstrate the ways of enhancing the economic stability on the market, to realize logistics reforms and effective products' promotion.
- Visual Basic Flowchart Example Inventory Maintenance
- Example Of Swot Analysis For Maintenance Engineer
- Examples Of Maintenance
- Example Bar Graph Showing Maintenance Planning
- Accounting Flowcharts | Visual Basic Flowchart Example Maintenance
- Maintenance Dashboard Examples
- Swot Analysis Example For Maintenance Department
- Vector Map of Germany | Manufacturing and Maintenance | Energy ...
- Accounting Flowcharts | Flow chart Example . Warehouse Flowchart ...
- Manufacture Examples