Basic Flowchart Symbols and Meaning


Entity Relationship Diagram Symbols

"Classic TQM Tools ...
Flow Charts Pictures, symbols or text coupled with lines, arrows on lines show direction of flow. Flowcharting enables
modeling of processes; problems/ opportunities and decision points etc. It develops a common understanding of a process by those in
volved." [whaqualitycenter.org/ Portals/ 0/ Tools%20 to%20 Use/ Classic%20 Quality%20 Tools/ Classic%20 TQM%20 Tools%20 R%20 2-12.pdf]
The vector stencils library TQM diagrams contains 58 symbols for drawing total quality management (TQM) flow charts using the ConceptDraw PRO diagramming and vector drawing software.
The example "Design elements - TQM diagram" is included in the Total Quality Management (TQM) Diagrams solution from the Quality area of ConceptDraw Solution Park.
TQM flow chart symbols

Data Flow Diagram Symbols. DFD Library

Flow Chart Symbols

Processing Flow Chart

ConceptDraw DIAGRAM enhanced with Flowcharts Solution from the "Diagrams" Area of ConceptDraw Solution Park is a powerful Processing Flow Chart software which will help save lots of your time.
"Classic TQM Tools ...
Flow Charts Pictures, symbols or text coupled with lines, arrows on lines show direction of flow. Flowcharting enables
modeling of processes; problems/ opportunities and decision points etc. It develops a common understanding of a process by those in
volved." [whaqualitycenter.org/ Portals/ 0/ Tools%20 to%20 Use/ Classic%20 Quality%20 Tools/ Classic%20 TQM%20 Tools%20 R%20 2-12.pdf]
The vector stencils library TQM diagrams contains 58 symbols for drawing total quality management (TQM) flow charts using the ConceptDraw PRO diagramming and vector drawing software.
The example "Design elements - TQM diagram" is included in the Total Quality Management (TQM) Diagrams solution from the Quality area of ConceptDraw Solution Park.
Flow Charts Pictures, symbols or text coupled with lines, arrows on lines show direction of flow. Flowcharting enables
modeling of processes; problems/ opportunities and decision points etc. It develops a common understanding of a process by those in
volved." [whaqualitycenter.org/ Portals/ 0/ Tools%20 to%20 Use/ Classic%20 Quality%20 Tools/ Classic%20 TQM%20 Tools%20 R%20 2-12.pdf]
The vector stencils library TQM diagrams contains 58 symbols for drawing total quality management (TQM) flow charts using the ConceptDraw PRO diagramming and vector drawing software.
The example "Design elements - TQM diagram" is included in the Total Quality Management (TQM) Diagrams solution from the Quality area of ConceptDraw Solution Park.
TQM flow chart symbols
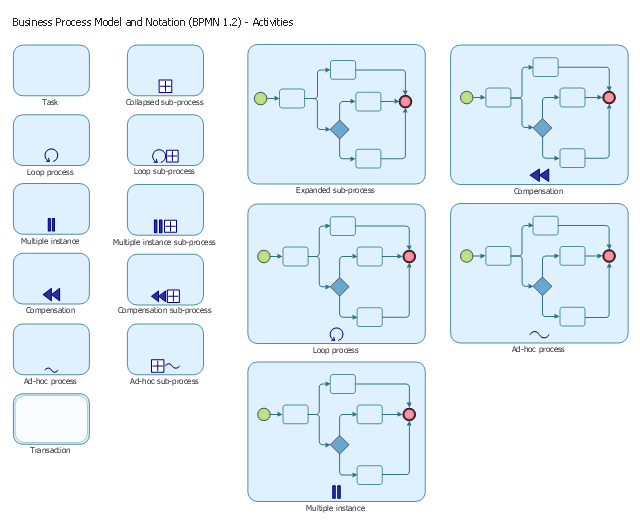
The vector stencils library "Activities BPMN 1.2" contains 16 activity symbols for drawing business process diagrams (Business Process Model and Notation) using the ConceptDraw PRO diagramming and vector drawing software.
"An activity is represented with a rounded-corner rectangle and describes the kind of work which must be done.
Task.
A task represents a single unit of work that is not or cannot be broken down to a further level of business process detail without diagramming the steps in a procedure (which is not the purpose of BPMN).
Sub-process.
Used to hide or reveal additional levels of business process detail. When collapsed, a sub-process is indicated by a plus sign against the bottom line of the rectangle; when expanded, the rounded rectangle expands to show all flow objects, connecting objects, and artifacts.
Has its own self-contained start and end events; sequence flows from the parent process must not cross the boundary.
Transaction.
A form of sub-process in which all contained activities must be treated as a whole; i.e., they must all be completed to meet an objective, and if any one of them fails, they must all be compensated (undone). Transactions are differentiated from expanded sub-processes by being surrounded by a double border.
Call Activity.
A point in the process where a global process or a global Task is reused. A call activity is differentiated from other activity types by a bolded border around the activity area." [Business Process Model and Notation. Wikipedia]
The shapes example "Design elements - Activities BPMN 1.2" is included in the Business Process Diagram solution from the Business Processes area of ConceptDraw Solution Park.
Activities BPMN 1.2 symbols
Accounting Flowchart Symbols

Sales Process Flowchart Symbols

- Symbol For For Loop In Flow Chart
- Basic Flowchart Symbols and Meaning | Accounting Flowchart ...
- Basic Flowchart Symbols and Meaning | Business feedback loop ...
- Feedback Loop Symbol
- Basic Flowchart Symbols and Meaning | Process Flow Chart | Flow ...
- Loop Flowchart Symbol
- Basic Flowchart Symbols and Meaning | Flowchart Symbol Forfor Loop
- The Flowchart Symbols Of The Control Structure In Java For Loop
- Qhich Symbol Is Used For For Loop
- Cross Functional Flowchart Shapes | While Loop Flowchart Symbol