This site uses cookies. By continuing to browse the ConceptDraw site you are agreeing to our Use of Site Cookies.

Scientific Symbols Chart

ConceptDraw DIAGRAM is the beautiful design software that provides many vector stencils, examples and templates for drawing different types of illustrations and diagrams.


Mathematics Solution from the Science and Education area of ConceptDraw Solution Park includes a few shape libraries of plane, solid geometric figures, trigonometrical functions and greek letters to help you create different professional looking mathematic illustrations for science and education.

HelpDesk

How to Draw Physics Diagrams
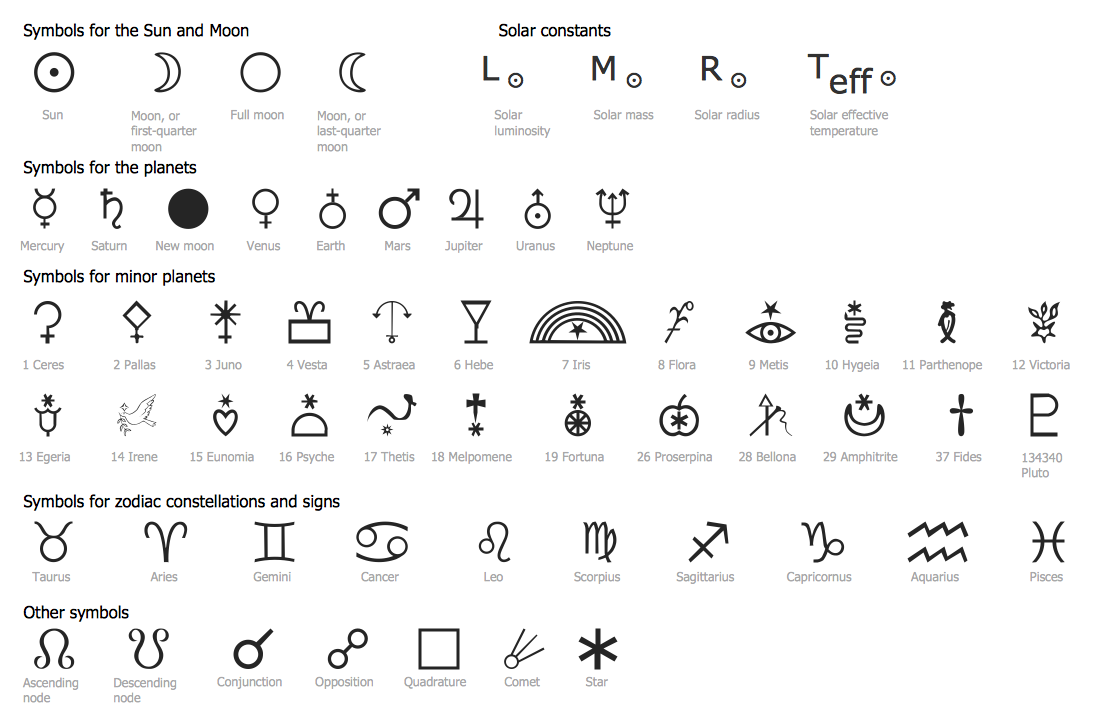
Physics charts can be helpful when you learn Physics, perform experiments, or solve any other tasks regarding Physics. ConceptDraw DIAGRAM allows you to draw physical diagrams of mechanical, nuclear, optical and electrical processes using the set of vector physics symbols and physics diagram templates. Nothing is more helpful in the study of physics as a visual representation of the physical processes: physics schemes, diagrams, and illustrations.

Astronomy Symbols

Are you an astronomer, astronomy teacher or student? And you need to draw astronomy pictures quick and easy? ConceptDraw DIAGRAM diagramming and vector drawing software extended with Astronomy solution from the Science and Education area will help you!
Astronomy solution provides 7 libraries with wide variety of predesigned vector objects of astronomy symbols, celestial bodies, solar system symbols, constellations, etc.

Physics Symbols

ConceptDraw DIAGRAM diagramming and vector drawing software extended with Physics solution from the Science and Education area is a powerful software for creating various physics diagrams.
Physics solution provides all tools that you can need for physics diagrams designing. It includes 3 libraries with predesigned vector physics symbols: Optics Library, Mechanics Library and Nuclear Physics Library.

Basic Diagramming Flowchart Software

ConceptDraw DIAGRAM is a powerful intelligent vector graphics tool for drawing flowcharts.

Column Chart Software

ConceptDraw Column Chart software allows drawing column charts using predesigned objects or drawing tools. In ConceptDraw Column Chart software you can find a complete set of column chart tools and objects.

Mathematics Symbols

ConceptDraw DIAGRAM extended with Mathematics solution from the Science and Education area is a powerful diagramming and vector drawing software that offers all needed tools for mathematical diagrams designing.
Mathematics solution provides 3 libraries with predesigned vector mathematics symbols and figures:
Solid Geometry Library, Plane Geometry Library and Trigonometric Functions Library.

Mathematical Diagrams

ConceptDraw DIAGRAM diagramming and vector drawing software extended with Mathematics solution from the Science and Education area is the best for creating: mathematical diagrams, graphics, tape diagrams various mathematical illustrations of any complexity quick and easy.
Mathematics solution provides 3 libraries: Plane Geometry Library, Solid Geometry Library, Trigonometric Functions Library.

Pyramid Charts

ConceptDraw DIAGRAM extended with Pyramid Diagrams Solution from the Marketing Area of ConceptDraw Solution Park is a powerful Pyramid Charts making software.
A Pyramid Chart has the form of triangle and hierarchically structures, organizes and help to analyze the information, data or ideas. Triangle is divided on the sections that usually have different widths. The width indicates the level of hierarchy among the topics.

Design Pictorial Infographics. Design Infographics

In the course of recent decades data visualization went through significant development and has become an indispensable tool of journalism, business intelligence and science. The way visual information may be conveyed is not limited simply to static or dynamic representation, it can also be interactive. Infographics can be conditionally divided into several general levels. Primarily, this is level of visualization of information, its interpretation and association on any ground. Second level can be defined as a visualization of knowledge, depiction of thoughts and ideas in the form of images or diagrams. Finally, the level of data visualization, which processes data arrays in charts, enabling the information to be more clearly perceived. You can also identify the main approaches to the creation of infographics: exploratory and narrative. Exploratory method insists on minimalist design in favor of data precision without unnecessary details and is common for scientific researches and ana

Chemistry Drawings

ConceptDraw DIAGRAM diagramming and vector drawing software extended with Chemistry solution from the Science and Education area is a powerful chemistry drawing software that is ideal for quick and easy designing of various: chemistry drawings, scientific and educational chemistry illustrations, schemes and diagrams of chemical and biological lab set-ups, images with chemical formulas, molecular structures, chemical reaction schemes, schemes of labware,
that can be then successfully used in the field of science and education, on various conferences, and so on.

Bar Graph

You need to draw the Bar Graph? The automated tool can be useful for you. ConceptDraw DIAGRAM diagramming and vector drawing software extended with Bar Graphs solution from Graphs and Charts area of ConceptDraw Solution Park will help you create any Bar Graph.

Process Flow Chart Symbols

Process Flow Chart is a visual diagram which shows the processes and relationships between the major components in a system, and uses for this the special process flow chart symbols: special shapes to represent different types of actions and process steps, lines and arrows to represent relationships and sequence of steps. It often named process flow diagram, it use colored flowchart symbols.
It is incredibly convenient to use the ConceptDraw DIAGRAM software extended with Flowcharts Solution from the "Diagrams" Area of ConceptDraw Solution Park for designing professional looking Process Flow Charts.

Audit Flowchart Symbols

Audit Flowchart helps you draw auditing diagrams for accounting, finance and money management, fiscal information tracking, decision making flow charts, financial inventories and documenting Six Sigma and ISO 9000 business processes.
Audit Flowchart Symbols - It’s efficiently to use the colors creating the audit flowcharts to make them bright, visual, attractive and successful. The best flowchart maker use ConceptDraw DIAGRAM features of RapidDraw technique.

Bar Diagrams for Problem Solving. Create space science bar charts with Bar Graphs Solution

Bar charts represent data in different categories or groups.
Create bar graphs for visual solving your scientific problems and data comparison using the ConceptDraw DIAGRAM diagramming and vector drawing software extended with the Bar Graphs Solution from the Graphs and Charts area of ConceptDraw Solition Park.