This site uses cookies. By continuing to browse the ConceptDraw site you are agreeing to our Use of Site Cookies.

flow chart software, flowchart maker, flowchart, flow chart Flowcharts

flow chart software, flowchart maker, flowchart, flow chart
The Flowcharts solution for ConceptDraw DIAGRAM is a comprehensive set of examples and samples in several varied color themes for professionals that need to represent graphically a process. Solution value is added by the basic flow chart template and shapes' libraries of flowchart notation. ConceptDraw DIAGRAM flow chart creator lets one depict the processes of any complexity and length, as well as design the Flowchart either vertically or horizontally.

System Design

ConceptDraw DIAGRAM system design software is a product of CS Odessa that was developed especially for making it much simpler to create all the needed diagrams, charts, flowcharts, schemes and other drawings when there is such a need in it. Having the Specification and Description Language (SDL) solution installed from the ConceptDraw STORE application may be another bonus to any ConceptDraw DIAGRAM diagramming and drawing software’s user as it offers both stencil libraries with the design elements and the pre-made examples of the diagrams, such as the SDL ones.

Venn Diagram Examples for Problem Solving. Computer Science. Chomsky Hierarchy

A Venn diagram, sometimes referred to as a set diagram, is a diagramming style used to show all the possible logical relations between a finite amount of sets. In mathematical terms, a set is a collection of distinct objects gathered together into a group, which can then itself be termed as a single object. Venn diagrams represent these objects on a page as circles or ellipses, and their placement in relation to each other describes the relationships between them.
The Venn diagram example below visualizes the the class of language inclusions described by the Chomsky hierarchy.

Diagram of a Basic Computer Network. Computer Network Diagram Example

What is a computer network? This is a set of devices and systems that are connected to each other (logically or physically) and communicate with each other. This could include servers, computers, phones, routers, and so on. The size of this network can reach the size of the Internet, and can consist of only two devices connected by a cable.
This sample shows the connection scheme of the home WLAN equipment to the Internet.

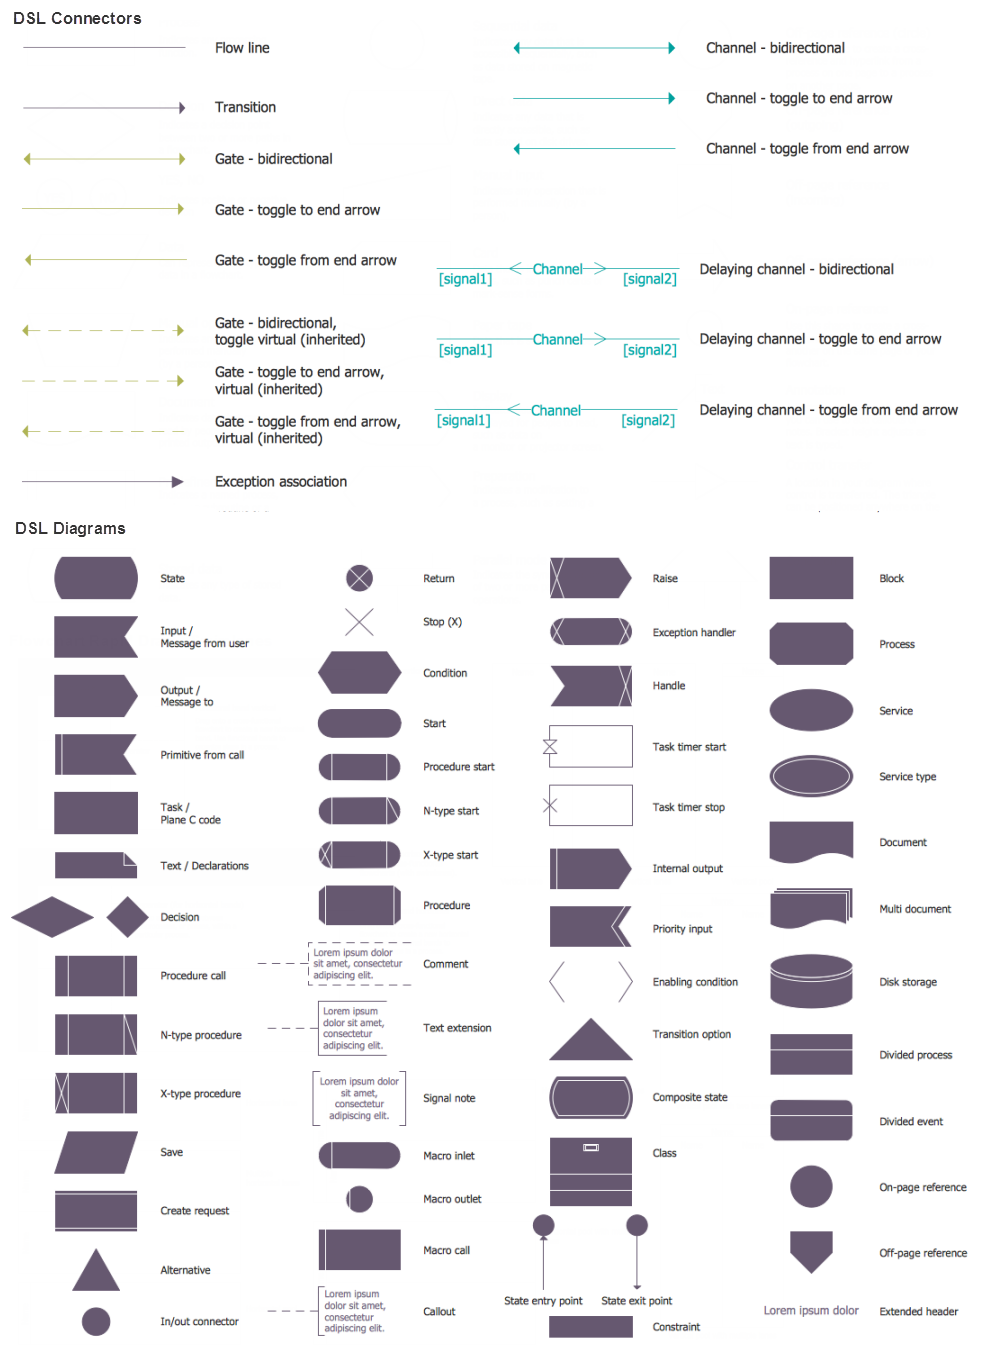
Flowchart Components
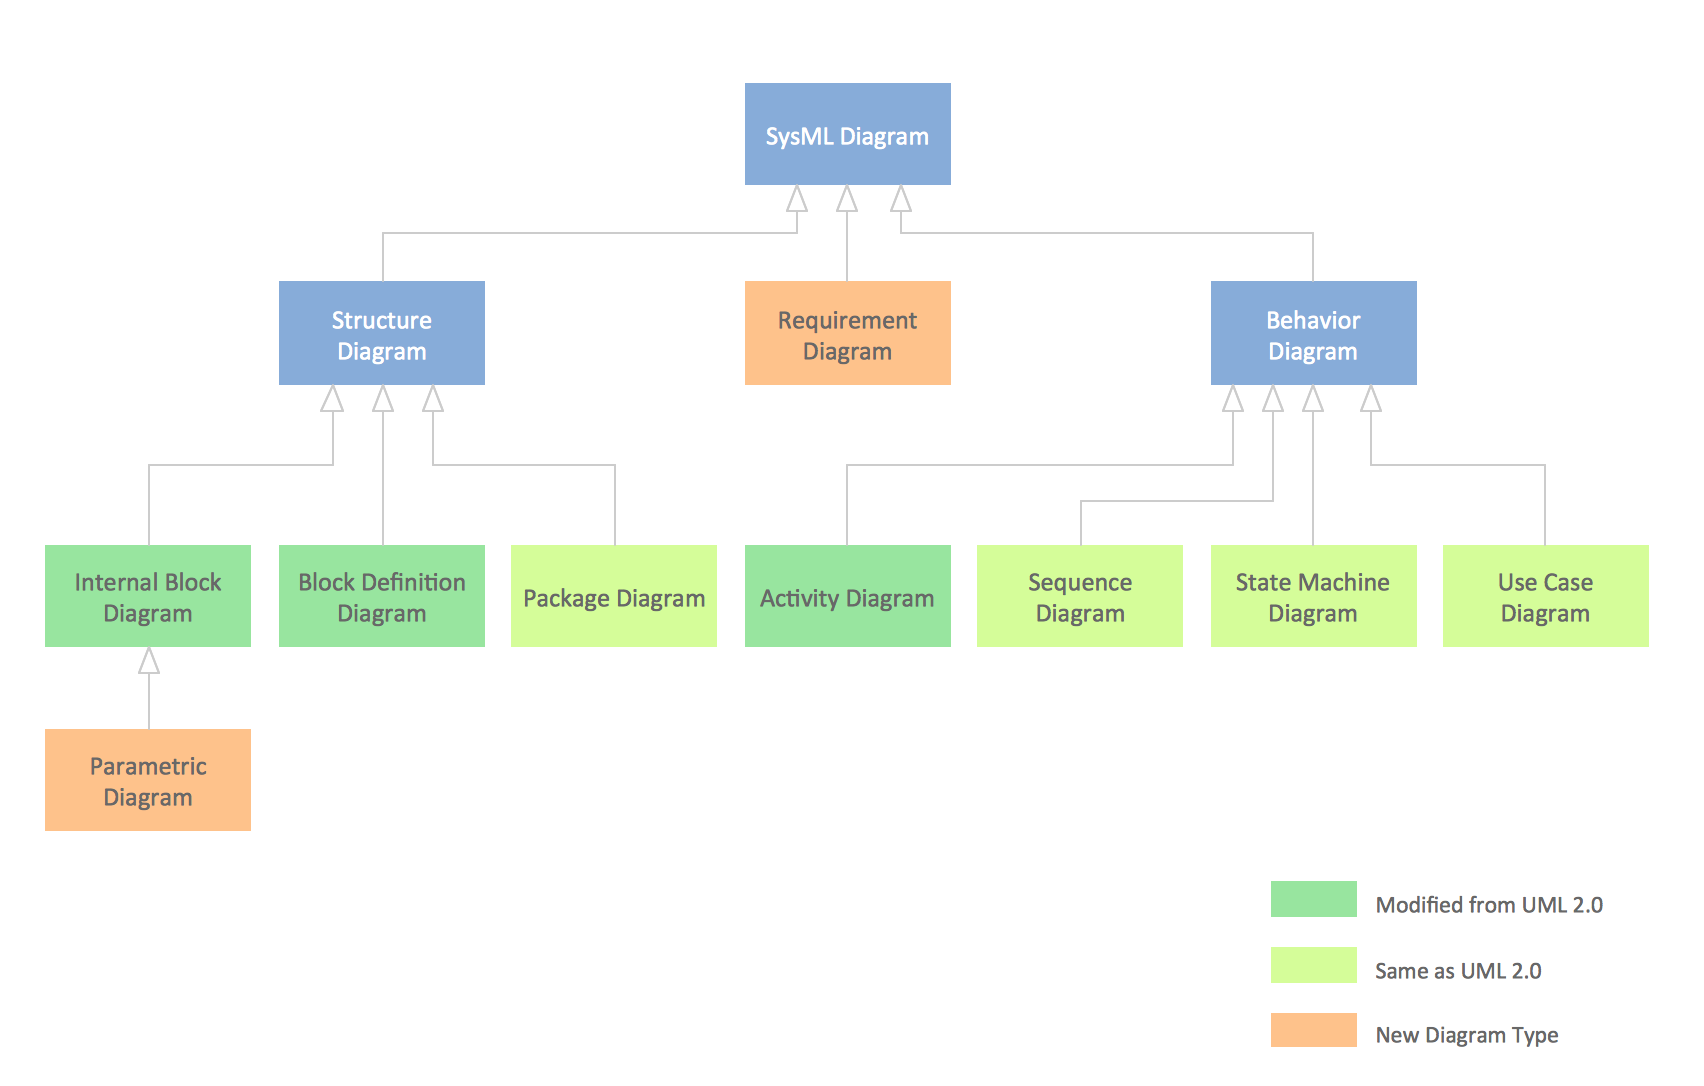
The ConceptDraw Flowchart component includes a set of samples and templates. This geathered as flowchart maker toolbox which focused on drawing flowcharts of any industry standards.

SysML Diagram

To draw SysML diagrams use the ConceptDraw DIAGRAM diagramming and vector drawing software extended with the Rapid UML solution from the Software Development area of ConceptDraw Solution Park.

Account Flowchart. Flowchart Examples

Create your own flow charts of computer or network system account processing using the ConceptDraw DIAGRAM diagramming and vector drawing software extended with the Cross-Functional Flowcharts solution from the Business Processes area of ConceptDraw Solution Park.
The flow chart example shows the computer network system account processing.

Types of Flowcharts

A Flowchart is a graphically representation of the process, algorithm or the step-by-step solution of the problem. There are ten types of Flowcharts. Using the Flowcharts solution from the Diagrams area of ConceptDraw Solution Park you can easy and quickly design the Flowchart of any of these types.
How to Simplify Flow Charting

interactive voice response system, IVR Interactive Voice Response Diagrams

interactive voice response system, IVR
Interactive Voice Response Diagrams solution extends ConceptDraw DIAGRAM software with samples, templates and libraries of ready-to-use vector stencils that help create Interactive Voice Response (IVR) diagrams illustrating in details a work of interactive voice response system, the IVR system’s logical and physical structure, Voice-over-Internet Protocol (VoIP) diagrams, and Action VoIP diagrams with representing voice actions on them, to visualize how the computers interact with callers through voice recognition and dual-tone multi-frequency signaling (DTMF) keypad inputs.