Flow chart Example. Warehouse Flowchart


Value Stream Mapping Symbols

 Logistics Flow Charts
Logistics Flow Charts solution extends ConceptDraw PRO v11 functionality with opportunities of powerful logistics management software. It provides large collection of predesigned vector logistic symbols, pictograms, objects and clipart to help you design with pleasure Logistics flow chart, Logistics process flow diagram, Inventory flow chart, Warehouse flowchart, Warehouse management flow chart, Inventory control flowchart, or any other Logistics diagram. Use this solution for logistics planning, to reflect logistics activities and processes of an enterprise or firm, to depict the company's supply chains, to demonstrate the ways of enhancing the economic stability on the market, to realize logistics reforms and effective products' promotion.
 Fishbone Diagrams
The Fishbone Diagrams solution extends ConceptDraw PRO v10 software with the ability to easily draw the Fishbone Diagrams (Ishikawa Diagrams) to clearly see the cause and effect analysis and also problem solving. The vector graphic diagrams produced using this solution can be used in whitepapers, presentations, datasheets, posters, and published technical material.
The vector stencils library "Value stream mapping" contains 43 VSM symbols.
Use it for drawing value stream maps in the ConceptDraw PRO diagramming and vector drawing software extended with the Value Stream Mapping solution from the Quality area of ConceptDraw Solution Park.
www.conceptdraw.com/ solution-park/ business-value-stream-mapping
Use it for drawing value stream maps in the ConceptDraw PRO diagramming and vector drawing software extended with the Value Stream Mapping solution from the Quality area of ConceptDraw Solution Park.
www.conceptdraw.com/ solution-park/ business-value-stream-mapping
Inventory
Inventory

Information Flow
Shipment
Shipment

Material Flow
Material Pull

FIFO Line
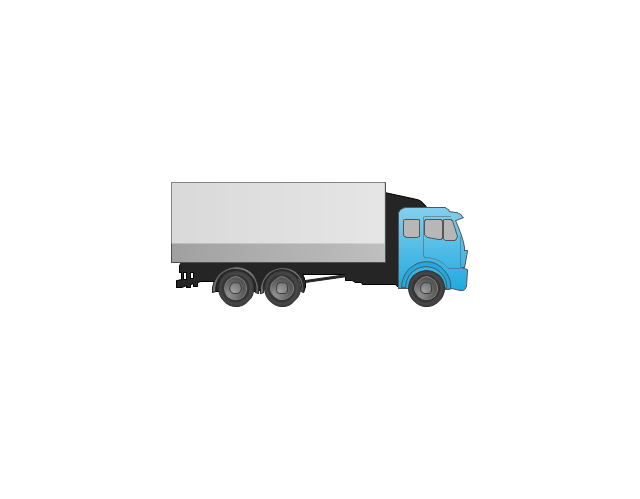
Truck shipment/Logistics
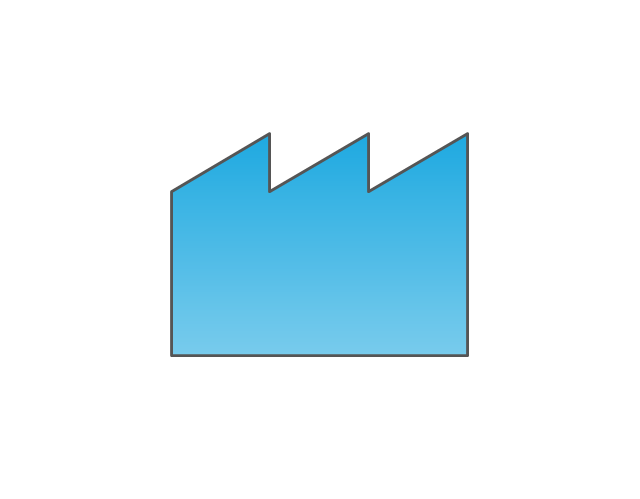
Customer/Supplier
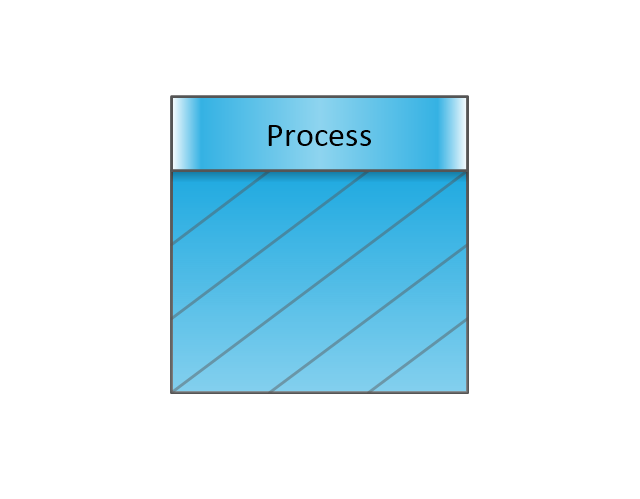
Dedicated Process

Shared Process
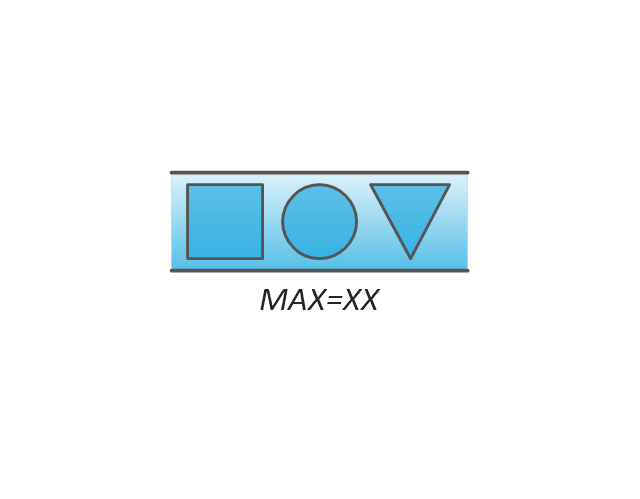
Supermarket Parts
Data Box
Workcell

Kaizen Burst

Operator

Other
Production Control
Manual Info
Electronic Information Flow
Production Kanban

Withdrawal Kanban

Signal Kanban
Kanban Post

Sequenced Pull

Load Levelling

MRP/ERP
Go-See

Pull Arrow
Manual Info
Pull Arrow
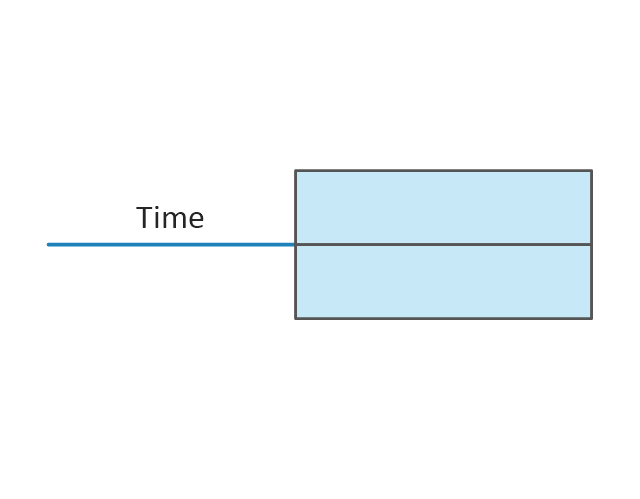
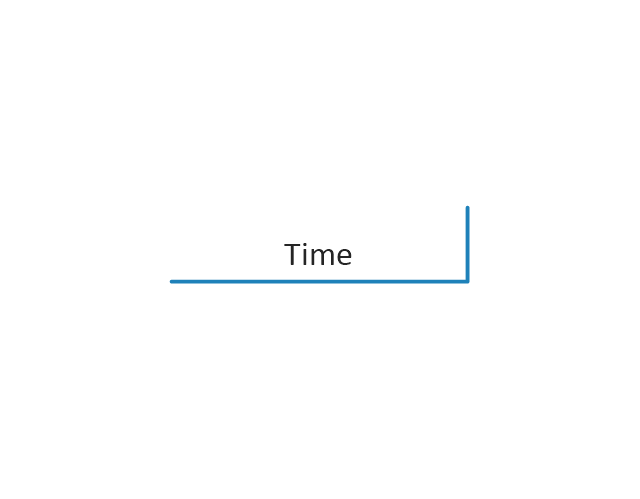
Timeline Total
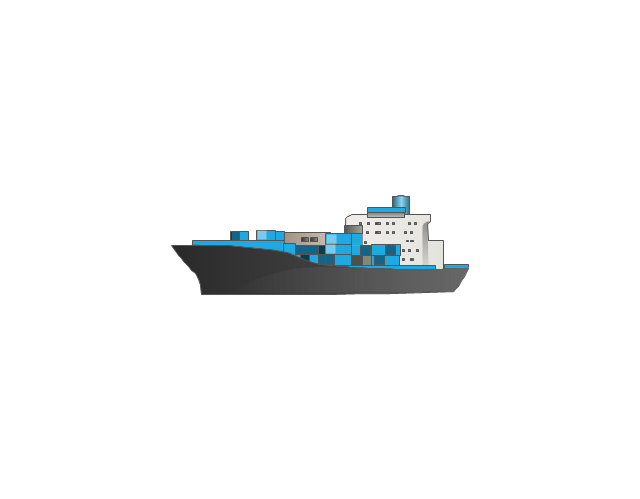
Ship
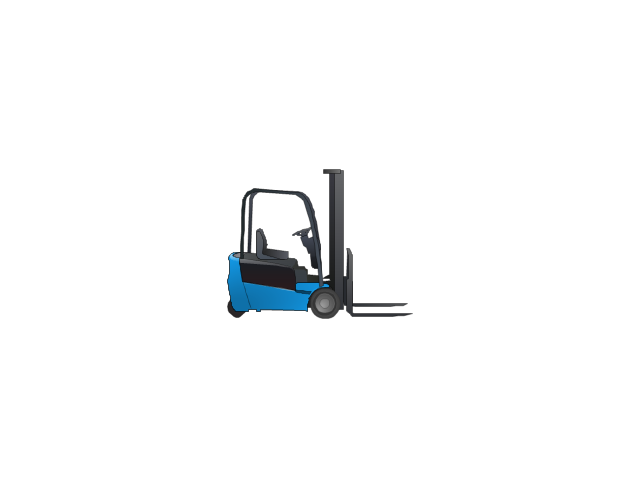
Forklift Truck
Plane

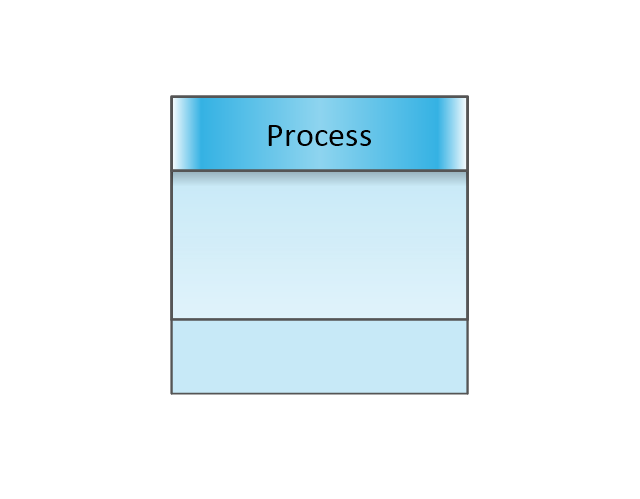
Process with Data
Timeline
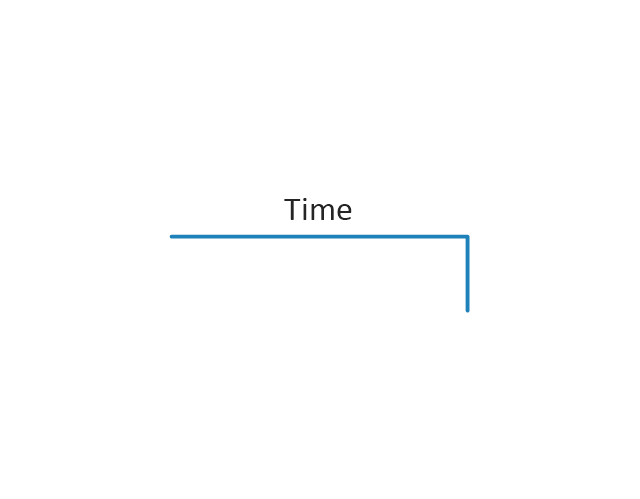
Timeline
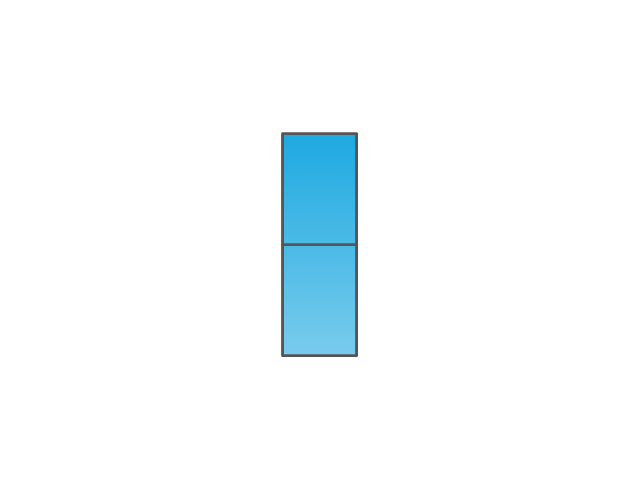
Supermarket, 2

Supermarket, 3

Safety stock, 2
Safety stock, 3
Material Requisition Flowchart. Flowchart Examples

"Value Stream Mapping (VSM):
– Special type of flow chart that uses symbols known as "the language of Lean" to depict and improve the flow of inventory information. ...
Value Stream Mapping ...
Provide optimum value to the customer through a complete value creation process with minimum waste in:
– Design (concept to customer);
– Design (concept to customer);
– Build (order to delivery);
– Sustain (in-use through life cycle to service)." [courses.washington.edu/ ie337/ Value_ Stream_ Mapping.pdf]
This sample Value Stream Map shows how customer value is created in the steps of manufacturing, production control, and shipping processes.
This VSM example was created using the ConceptDraw PRO diagramming and vector drawing software extended with the Value Stream Mapping solution from the Quality area of ConceptDraw Solution Park.
Value stream mapping

Flowchart Components

Data Flow Diagram Model

Check Order Process Flowchart. Flowchart Examples

- Manufacturing Inventory Management Flow Chart
- How to Make a Logistics Flow Chart | Production Flow
- Sale Inventory Process For Supermarket Store Flowchart
- Consumable Inventory Management Process
- Logistics Flow Charts | Automobile Manufacturing Process Flow ...
- Er Diagram For Production And Distribution Management System
- Production Process Flow Sample
- Inventory Performance Dynamics Dashboard | Value stream ...
- How Do Fishbone Diagrams Solve Manufacturing Problems ...
- Logistics Flow Charts | Process Flowchart | How to Make a Logistics ...