Functional Block Diagram
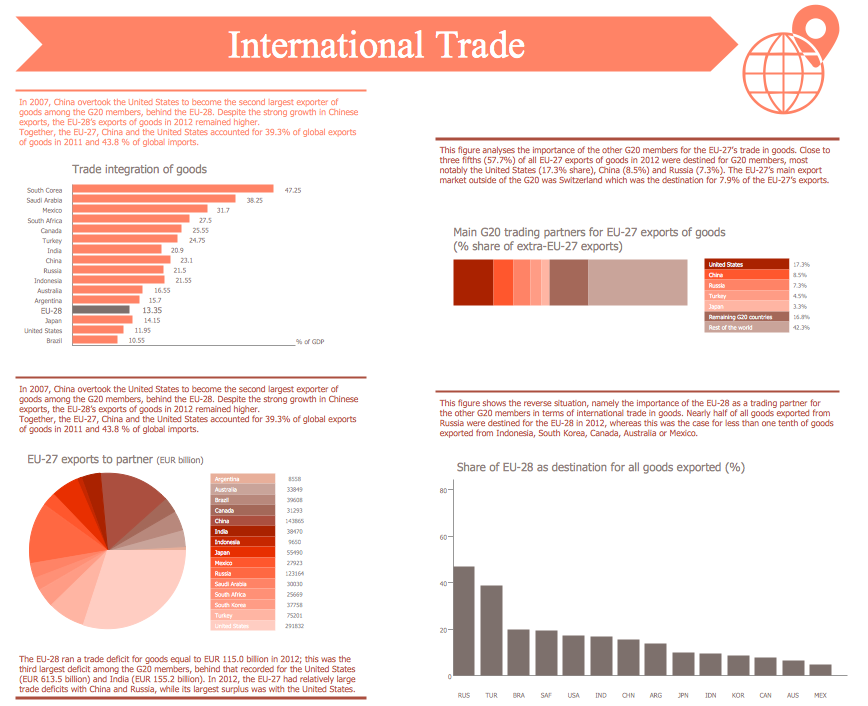
You need design the Functional Block Diagram and dream to find the useful tools to draw it easier, quickly and effectively? ConceptDraw PRO offers the Block Diagrams Solution from the "Diagrams" Area which will help you!
 Seven Management and Planning Tools
Seven Management and Planning Tools solution extends ConceptDraw PRO and ConceptDraw MINDMAP with features, templates, samples and libraries of vector stencils for drawing management mind maps and diagrams.
Digital Communications Network. Computer and Network Examples
The digital communication is a physical transfer of the data over a point-to-point or point-to-multipoint communication channel. Channels can be copper wires, optical fibres, wireless communication channels, etc. The data are realized as electromagnetic signals (radiowave, microwave, electrical voltage, etc.). This example was created in ConceptDraw PRO using the Computer and Networks Area of ConceptDraw Solution Park and shows the Digital Communication Network diagram.
Types of Flowchart - Overview
When designing a process or an instruction in clear and understandable way, you should consider creating a flowchart. You can avoid spending a lot of time understanding complex concepts as they get clear with different diagrams. The flowcharts are very popular diagram type, they are useful at different fields from the description business processes to the presentation of cooking recipes. Basic Flowchart, Business Process Modeling Diagram, Process Flowchart, Cross Functional Flowchart, Procedure Flowchart, Data Flow Diagram, IDEF Flowchart, SDL Diagram, Workflow Diagram, Document Flowchart, Program Flowchart, Value Stream Map, System Flowchart, Highlight Flowchart, Sales Flowchart are the main types flowchart. The ConceptDraw PRO is one of the professional applications which has great advantages and using which you can create different types of Flowcharts easy and fast. Try to draw an illustrative and comprehensible diagram in ConceptDraw PRO describing the processes instead of writing complex long text and make sure how it is convenient. Visio is expensive, and if you use it in a team environment, these costs are compounded. ConceptDraw PRO is an affordable alternative to Visio and luckily, it comes with a team plan. ConceptDraw PRO can import and export Visio files, so Mac users can collaborate with PC users stuck on Microsoft's software.
Linux Audit Flowchart Example. Flowchart Examples
Create your own Linux audit flowcharts using the ConceptDraw PRO diagramming and vector drawing software extended with the Audit Flowcharts solution from the Finance and Accounting area of ConceptDraw Solution Park. This flowchart example describing auditd, the linux audit tool.Simple Flow Chart
ConceptDraw PRO diagramming and vector drawing software extended with Flowcharts Solution from the 'Diagrams' area of ConceptDraw Solution Park is a powerful tool for drawing Flow Charts of any complexity you need. Irrespective of whether you want to draw a Simple Flow Chart or large complex Flow Diagram, you estimate to do it without efforts thanks to the extensive drawing tools of Flowcharts solution, there are professional flowchart symbols and basic flowchart symbols. This sample shows the Gravitational Search Algorithm (GSA) that is the optimization algorithm.Marketing Infographics
Marketing Infographics is a very popular tool that allows to represent the complex data, knowledge, and other marketing information in a simple, visual and attractive graphical form. But how to draw Marketing Infographics simply and quickly? ConceptDraw PRO diagramming and vector drawing software extended with unique Marketing Infographics Solution from the Business Infographics Area will help you design marketing infographics without efforts. This toolset included in ConceptDraw Office for small business project management, creating presentations using marketing infographics is critical part project management reporting software.Flowchart on Bank. Flowchart Examples
This sample was created in ConceptDraw PRO diagramming and vector drawing software using the Flowcharts solution from the Diagrams area of ConceptDraw Solution Park. This sample shows the Flowchart of the Subprime Mortgage Crisis. This Flowchart describes the decline in housing prices when the housing bubble burst and what it caused on the housing and financial markets. You can also see the Government and Industry responses in this crisis situation.
UML Class Diagram Constructor
UML Class Diagrams is a type of static structure diagram that is used both for general conceptual modeling of the systematics of the application, and for detailed modeling translating the models into programming code. It describes the structure of a system by showing the: classes of a system, attributes, operations, and the relationships between them. The Rapid UML Solution for ConceptDraw PRO includes the UML Class Diagram library that helps you to design the UML Class Diagram quick and easy. You can simply and quickly drop the ready-to-use objects from the library into your document to create the UML Class Diagram.Hotel Service Process
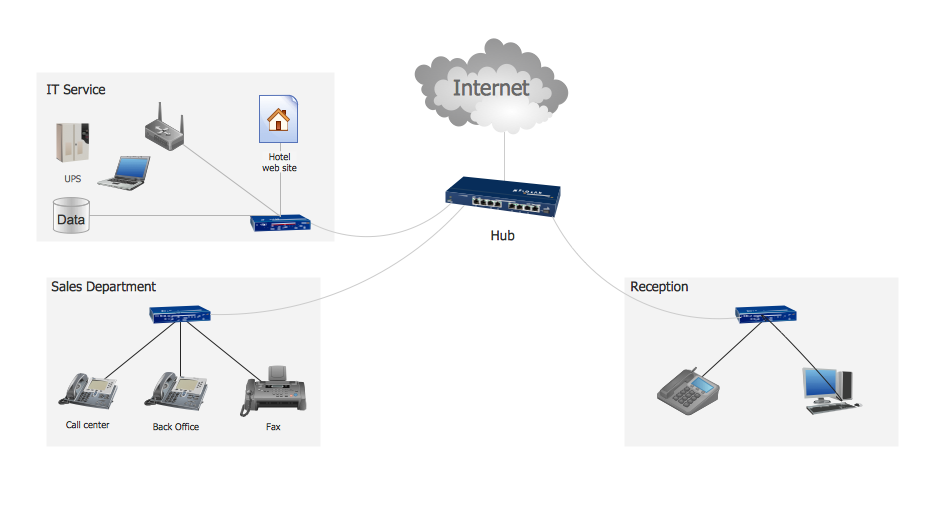
This sample shows computer network diagram of the hotel service process, structure of the hotel service departments and the connection of each department to the internet using the WLAN equipment (routers, hub. etc.). This sample was created in ConceptDraw PRO diagramming and vector drawing software using the Computer and Networks solution from Computer and Networks area of ConceptDraw Solution Park.Flow Chart Creator
ConceptDraw PRO is a flowchart design software. There are large collections of professional flowchart symbols for process flow diagrams, standard flowchart symbols and colored basic flowchart symbols. Built-in examples and video lessons allow users to get started immediately and do drawing of virtually any type of flowchart or process flow diagrams"Interrelationship Digraph (ID).
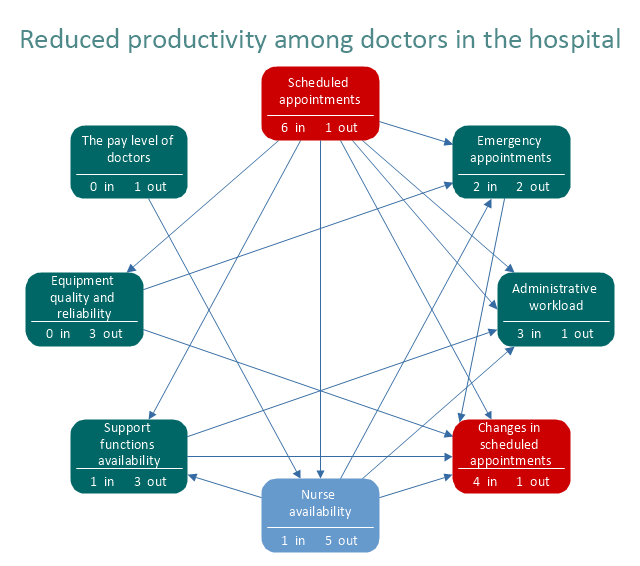
This tool displays all the interrelated cause-and-effect relationships and factors involved in a complex problem and describes desired outcomes. The process of creating an interrelationship digraph helps a group analyze the natural links between different aspects of a complex situation." [Seven Management and Planning Tools. Wikipedia]
"Causality (also referred to as causation) is the relation between an event (the cause) and a second event (the effect), where the second event is understood as a consequence of the first.
In common usage, causality is also the relation between a set of factors (causes) and a phenomenon (the effect). Anything that affects an effect is a factor of that effect. A direct factor is a factor that affects an effect directly, that is, without any intervening factors. (Intervening factors are sometimes called "intermediate factors".) The connection between a cause(s) and an effect in this way can also be referred to as a causal nexus.
Though the causes and effects are typically related to changes or events, candidates include objects, processes, properties, variables, facts, and states of affairs; characterizing the causal relation can be the subject of much debate." [Causality. Wikipedia]
The relations diagram example "Health care" was created using the ConceptDraw PRO diagramming and vector drawing software extended with the solution "Seven Management and Planning Tools" from the Management area of ConceptDraw Solution Park.
Network Security Tips
The Internet is a huge world with unlimited possibilities. But with all its numerous advantages, the Internet also conceals many dangers and security threats, that's why we advise you to follow simple network security tips. ConceptDraw PRO diagramming and vector drawing software supplied with Network Security Diagrams Solution from the Computer and Networks Area of ConceptDraw Solution Park is an ideal software for easy designing Network Security Diagrams and attractive illustrations with effective network security tips.- Entity Relationship Diagram Symbols | PROBLEM ANALYSIS. Root ...
- Process Flowchart | Cross-Functional Flowchart | IDEF3 Standard ...
- Flow chart Example . Warehouse Flowchart | Draw A Company ...
- Entity- Relationship Diagram
- Entity- Relationship Diagram (ERD) with ConceptDraw PRO ...
- Interrelationship Of Carbohydrate Fat And Protein Metabolism Flow ...
- Seven Management and Planning Tools | Interrelationship Diagram ...
- Interrelationship Between Objective And Process Diagram
- Entity- Relationship Diagram (ERD) with ConceptDraw PRO | Types ...
- Interrelation Diagram Example
- Interrelationship Of Health And Development Diagram
- Interrelationship
- Interrelationship Diagram Wikipedia
- Interrelationship Diagram In Management Tools For Problem Solving
- Draw A Company Organogram Showing The Inter Relationship ...
- Inter Relationship Digraph Tool
- 4 Level pyramid model diagram - Information systems types ...
- Basic Flowchart Symbols and Meaning | Computer and Networks ...
- Diagrammatic Representation Of Interrelationship Of Metabolic ...
- Relationship Symbols And Meanings


