 Entity-Relationship Diagram (ERD)
Entity-Relationship Diagram (ERD) solution extends ConceptDraw PRO software with templates, samples and libraries of vector stencils from drawing the ER-diagrams by Chen's and crow’s foot notations.
"Chen's notation for entity–relationship modeling uses rectangles to represent entity sets, and diamonds to represent relationships appropriate for first-class objects: they can have attributes and relationships of their own. If an entity set participates in a relationship set, they are connected with a line.
Attributes are drawn as ovals and are connected with a line to exactly one entity or relationship set.
Cardinality constraints are expressed as follows:
- a double line indicates a participation constraint, totality or surjectivity: all entities in the entity set must participate in at least one relationship in the relationship set;
- an arrow from entity set to relationship set indicates a key constraint, i.e. injectivity: each entity of the entity set can participate in at most one relationship in the relationship set;
- a thick line indicates both, i.e. bijectivity: each entity in the entity set is involved in exactly one relationship.
- an underlined name of an attribute indicates that it is a key: two different entities or relationships with this attribute always have different values for this attribute.
Attributes are often omitted as they can clutter up a diagram; other diagram techniques often list entity attributes within the rectangles drawn for entity sets." [Entity–relationship model. Wikipedia]
The vector stencils library ERD, Chen's notation contains 13 symbols for drawing entity-relatinship diagrams using the ConceptDraw PRO diagramming and vector drawing software.
The example "Design elements - ER diagram (Chen notation)" is included in the Entity-Relationship Diagram (ERD) solution from the Software Development area of ConceptDraw Solution Park.
Chen's ERD
.png--diagram-flowchart-example.png)
"Crow's Foot notation is used in Barker's Notation, SSADM and Information Engineering. Crow's Foot diagrams represent entities as boxes, and relationships as lines between the boxes. Different shapes at the ends of these lines represent the cardinality of the relationship." [Entity–relationship model. Wikipedia]
The vector stencils library ERD, crow's foot notation contains 17 symbols for creating the ER-diagrams using the ConceptDraw PRO diagramming nd vector drawing software.
The example"Design elements - ERD solution (crow's foot notation)" is included in the Entity-Relationship Diagram (ERD) solution from the Software Development area of ConceptDraw Solution Park.
Crow's foot ERD
.png--diagram-flowchart-example.png)
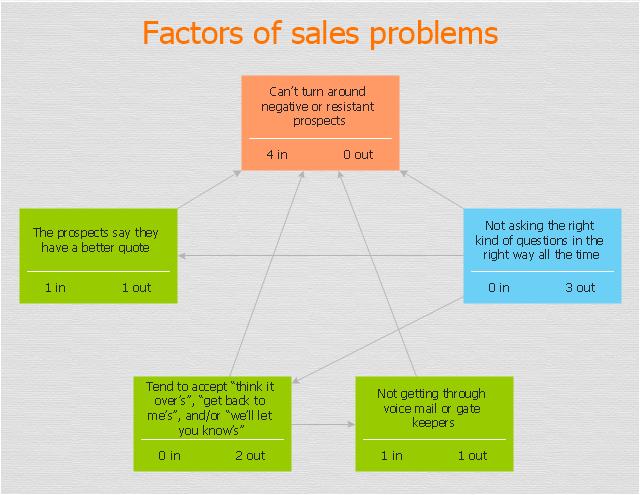
"The Interrelationship Digraph is used to determine, analyse and classify the cause and effect relationship that occurs between all of the important issues. This process is used when a group is unsure which of a group of issues has the greatest effect on all of the other issues." [decd.sa.gov.au/ speced2/ files/ links/ link_ 66898.pdf]
The relations diagram example "Sales process" was created using the ConceptDraw PRO diagramming and vector drawing software extended with the solution "Seven Management and Planning Tools" from the Management area of ConceptDraw Solution Park.
The relations diagram example "Sales process" was created using the ConceptDraw PRO diagramming and vector drawing software extended with the solution "Seven Management and Planning Tools" from the Management area of ConceptDraw Solution Park.
Relations diagram
 Audio and Video Connectors
Audio and video connectors solution extends ConceptDraw PRO software with templates, samples and library of vector stencils for drawing audio and video hook up diagrams.
 ConceptDraw Solution Park
ConceptDraw Solution Park collects graphic extensions, examples and learning materials
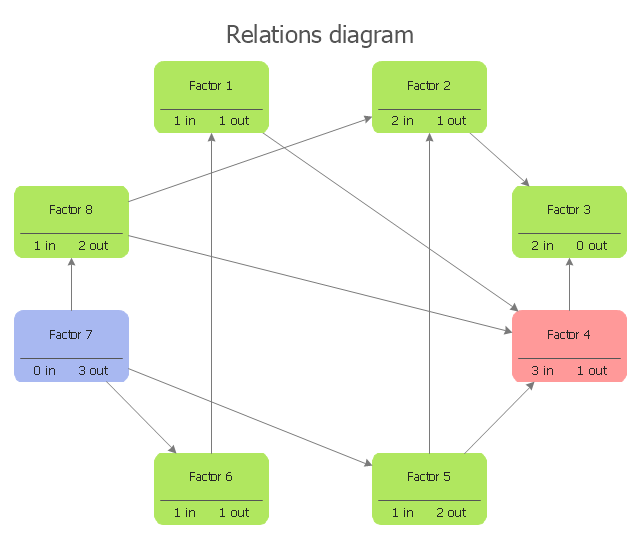
"Interrelationship digraph is a method to identify relationships among a set of items. Items that have a cause or effect associated on another item are linked together (and given weight) for the purpose of identifying the items most affected or items affecting other items the most, giving emphasis on those items for risk mitigation planning. Items involved in risk management could be risks being mitigated, risk strategies, project activities or resources. ...
This method fosters broad thinking of individuals to identify interrelationships of risk items that affect the whole project, determining critical risk areas that must be dealt first and ensures efficient allocation of project resources." [sce.uhcl.edu/ helm/ Risk_ Man_ WEB/ Planning%20 Worksheet%20 Notes_ files%5Cintrldgm.htm]
Relation diagram (interrelationship digraph, relationships digram) helps identify what factors are causes and which factors are effects. Factors help establish KPI (Key Performance Indicators) to monitor changes and the effectiveness of corrective actions in resolving a problem.
The relations diagram is one of the Seven Management and Planning Tools (7 MP tools, Seven New Quality Tools).
The relations diagram template for the ConceptDraw PRO diagramming and vector drawing software is included in the solution "Seven Management and Planning Tools" from the Management area of ConceptDraw Solution Park.
Interrelationship digraph template
- ERD Symbols and Meanings | Entity Relationship Diagram Symbols ...
- ERD Symbols and Meanings | Design Element: Chen for Entity ...
- ERD Symbols and Meanings | What is Entity- Relationship Diagram ...
- ERD Symbols and Meanings | Entity Relationship Diagram ...
- ERD Symbols and Meanings | Entity Relationship Diagram Software ...
- Entity Relationship Diagram Symbols | ERD Symbols and Meanings ...
- ERD Symbols and Meanings | Entity- Relationship Diagram (ERD ...
- ER diagram tool for OS X | ERD Symbols and Meanings | Entity ...
- Entity- Relationship Diagram (ERD) | ERD Symbols and Meanings ...
- Entity Relationship Diagram Examples
- Entity Relationship Diagram Examples - Conceptdraw.com
- ERD Symbols and Meanings | Design Element: Crows Foot for Entity ...
- ERD Symbols and Meanings | Design elements - ER diagram (Chen ...
- Entity- Relationship Diagram (ERD)
- ER Diagrams with ConceptDraw PRO | ERD Symbols and Meanings ...
- Entity- Relationship Diagram
- Entity Relationship Diagram Symbols | ERD Symbols and Meanings ...
- ERD Symbols and Meanings | Pyramid Diagram | Aerospace and ...
- Entity Relationship Diagram Software Engineering | ERD Symbols ...
- ERD Symbols and Meanings | Process Flowchart |