Authority Matrix Diagram Software

 Entity-Relationship Diagram (ERD)
An Entity-Relationship Diagram (ERD) is a visual presentation of entities and relationships. That type of diagrams is often used in the semi-structured or unstructured data in databases and information systems. At first glance ERD is similar to a flowch
Entity Relationship Diagram Software Engineering

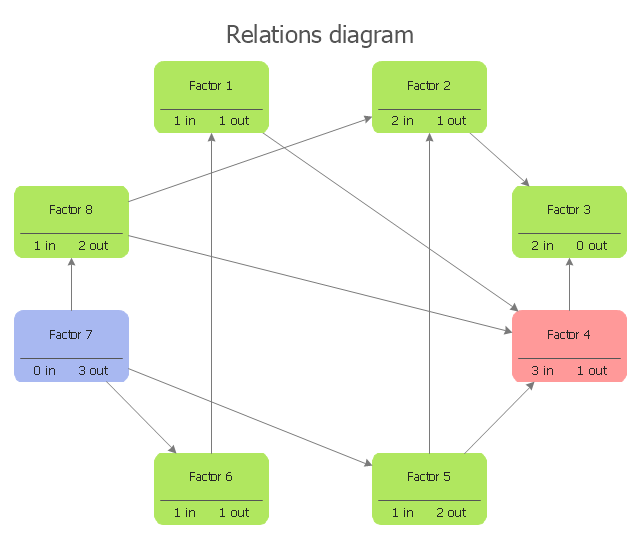
PROBLEM ANALYSIS. Relations Diagram


Entity Relationship Diagram Examples


"Interrelationship digraph is a method to identify relationships among a set of items. Items that have a cause or effect associated on another item are linked together (and given weight) for the purpose of identifying the items most affected or items affecting other items the most, giving emphasis on those items for risk mitigation planning. Items involved in risk management could be risks being mitigated, risk strategies, project activities or resources. ...
This method fosters broad thinking of individuals to identify interrelationships of risk items that affect the whole project, determining critical risk areas that must be dealt first and ensures efficient allocation of project resources." [sce.uhcl.edu/ helm/ Risk_ Man_ WEB/ Planning%20 Worksheet%20 Notes_ files%5Cintrldgm.htm]
Relation diagram (interrelationship digraph, relationships digram) helps identify what factors are causes and which factors are effects. Factors help establish KPI (Key Performance Indicators) to monitor changes and the effectiveness of corrective actions in resolving a problem.
The relations diagram is one of the Seven Management and Planning Tools (7 MP tools, Seven New Quality Tools).
The relations diagram template for the ConceptDraw PRO diagramming and vector drawing software is included in the solution "Seven Management and Planning Tools" from the Management area of ConceptDraw Solution Park.
Interrelationship digraph template
Entity Relationship Diagram Software for Mac

Prioritization Matrix

Components of ER Diagram

Cause and Effect Analysis

- Interrelationship Diagram Wikipedia
- Entity- Relationship Diagram (ERD) | IDEF1 standard | Interrelation ...
- Risk Tree Diagram
- FTA diagram - Hazard analysis | Accident analytic tree - FTA ...
- Entity Relationship Diagram Symbols | PROBLEM ANALYSIS ...
- Root cause analysis tree diagram - Template | Fault Tree Analysis ...
- Fault Tree Analysis Diagrams | Tree Diagram In Total Quality ...
- Entity Relationship Diagram - ERD - Software for Design Crows Foot ...
- Entity Relationship Diagram Symbols
- Cause and Effect Analysis