Piping and Instrumentation Diagram Software

Process and Instrumentation Diagram
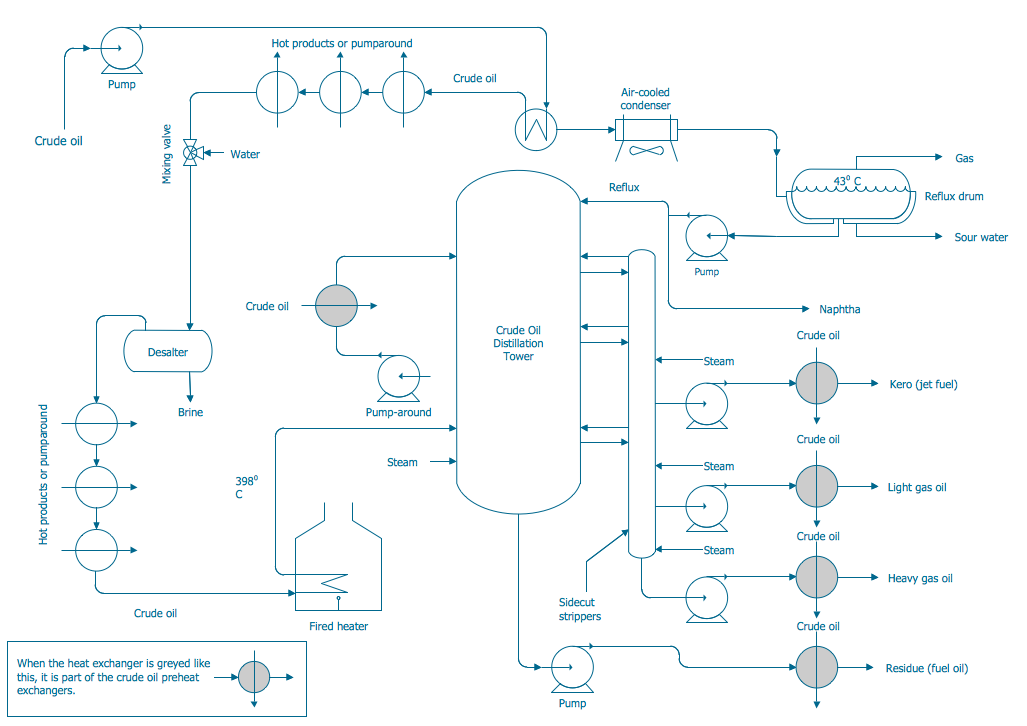
"A piping and instrumentation diagram/ drawing (P&ID) is a diagram in the process industry which shows the piping of the process flow together with the installed equipment and instrumentation. ...
P&IDs play a significant role in the maintenance and modification of the process that it describes. It is critical to demonstrate the physical sequence of equipment and systems, as well as how these systems connect. During the design stage, the diagram also provides the basis for the development of system control schemes, allowing for further safety and operational investigations, such as a Hazard Analysis and Operability Study...
For processing facilities, it is a pictorial representation of:
Key piping and instrument details,
Control and shutdown schemes,
Safety and regulatory requirements,
Basic start up and operational information." [Piping and instrumentation diagram. Wikipedia]
The piping and instrumentation diagram template for the ConceptDraw PRO diagramming and vector drawing software is included in the Chemical and Process Engineering solution from the Engineering area of ConceptDraw Solution Park.
Piping and instrumentation diagram / drawing (P&ID)
-piping-and-instrumentation-diagram-template.png--diagram-flowchart-example.png)
This DFD sample was created on the base of the figure from the NASA website. [asd-www.larc.nasa.gov/ ATBD/ DFD.html]
"Clouds and the Earth's Radiant Energy System (CERES).
EOS-Terra: Understanding Earth's Clouds and Climate.
The Clouds and the Earth's Radiant Energy System (CERES) instrument is one of several that will be flown aboard the Earth Observing System's Terra spacecraft, scheduled for launch in late1999. The data from the CERES instrument will be used to study the energy exchanged between the Sun; the Earth's atmosphere, surface and clouds; and outer space.
The CERES EOS-Terra instrument will be the second CERES instrument in Earth orbit. The first CERES instrument is currently orbiting the Earth aboard the Tropical Rainfall Measuring Mission observatory, which was launched in November 1997. Early results of the TRMM mission show that the first CERES has provided better measurement capabilities than any previous satellite instrument of its kind.
What CERES Will Measure.
CERES will measure the energy at the top of the atmosphere, as well as estimate energy levels in the atmosphere and at the Earth's surface. Using information from very high resolution cloud imaging instruments on the same spacecraft, CERES also will determine cloud properties, including cloud amount, altitude, thickness, and the size of the cloud particles. All of these measurements are critical for advancing our understanding of the Earth's total climate system and further improving climate prediction models.
The CERES instrument is based on NASA Langley's highly successful Earth Radiation Budget Experiment (ERBE) which used three satellites to provide global energy budget measurements from 1984 to 1990." [nasa.gov/ centers/ langley/ news/ factsheets/ CERES.html]
The DFD example "CERES data flow diagram" was created using the ConceptDraw PRO diagramming and vector drawing software extended with the Data Flow Diagrams solution from the Software Development area of ConceptDraw Solution Park.
DFD

Process Flow Diagram Symbols

HelpDesk
How to Create a Bubble Diagram

Entity Relationship Diagram - ERD - Software for Design Chen ER Diagrams
_Win_Mac.png)
Technical Drawing Software

Electrical Symbols, Electrical Diagram Symbols

Mechanical Drawing Symbols

- Process Instrument Diagram Symbols
- Process Instrument Diagram Of Distillation Column
- Piping And Instrument Diagram Symbol Pipefitter Pdf
- Piping And Instrumentation Diagram For Distillation Column
- Piping And Instrument Diagram Symbols
- Chemistry All Instrument Diagram And Their Uses
- Bio Flowchart Lite | Laboratory Instrument Diagram
- Diagrams Of Instrument Used In Laboratory
- Piping and Instrumentation Diagram Software | Chemical and ...
- Process Flowchart | Process and Instrumentation Diagram | Process ...