This financila dashboard example was drawn on the base of the Enterprise dashboard from the Mecklenburg County Government website.
[charmeck.org/ mecklenburg/ county/ CountyManagersOffice/ OMB/ dashboards/ Pages/ Enterprise.aspx]
"In management information systems, a dashboard is "an easy to read, often single page, real-time user interface, showing a graphical presentation of the current status (snapshot) and historical trends of an organization’s key performance indicators to enable instantaneous and informed decisions to be made at a glance."
For example, a manufacturing dashboard may show key performance indicators related to productivity such as number of parts manufactured, or number of failed quality inspections per hour. Similarly, a human resources dashboard may show KPIs related to staff recruitment, retention and composition, for example number of open positions, or average days or cost per recruitment.
Types of dashboards.
Dashboard of Sustainability screen shot illustrating example dashboard layout.
Digital dashboards may be laid out to track the flows inherent in the business processes that they monitor. Graphically, users may see the high-level processes and then drill down into low level data. This level of detail is often buried deep within the corporate enterprise and otherwise unavailable to the senior executives.
Three main types of digital dashboard dominate the market today: stand alone software applications, web-browser based applications, and desktop applications also known as desktop widgets. The last are driven by a widget engine.
Specialized dashboards may track all corporate functions. Examples include human resources, recruiting, sales, operations, security, information technology, project management, customer relationship management and many more departmental dashboards.
Digital dashboard projects involve business units as the driver and the information technology department as the enabler. The success of digital dashboard projects often depends on the metrics that were chosen for monitoring. Key performance indicators, balanced scorecards, and sales performance figures are some of the content appropriate on business dashboards." [Dashboard (management information systems). Wikipedia]
The example "Enterprise dashboard" was created using the ConceptDraw PRO diagramming and vector drawing software extended with the Composition Dashboard solution from the area "What is a Dashboard" of ConceptDraw Solution Park.
Financial dashboard

 ConceptDraw Solution Park
ConceptDraw Solution Park collects graphic extensions, examples and learning materials
LLNL Flow Charts
.jpg "LLNL flow charts")
 Network Security Diagrams
The Network Security Diagrams solution enhances the ConceptDraw PRO v10 functionality with large collection of predesigned vector stencils of cybersecurity clipart, shapes, icons and connectors to help you succeed in designing professional and accurate Ne
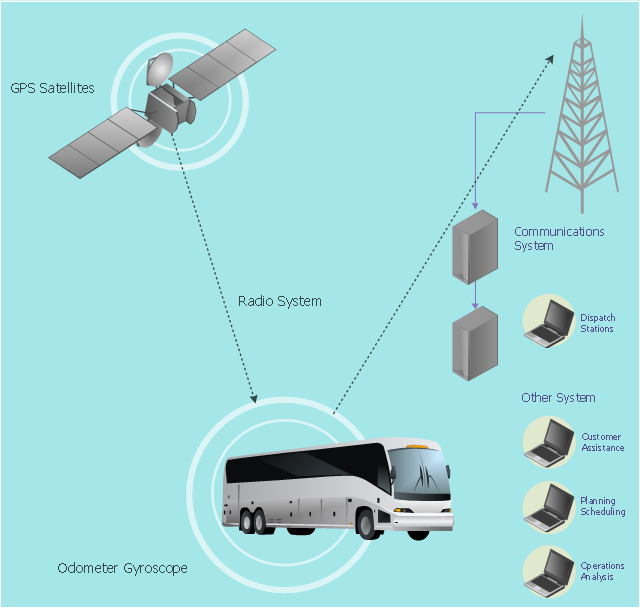
This vehicular network diagram example was drawn on the base of picture illustrating the article "Automatic Vehicle Location: Rural Transit" from the website of the Research and Innovative Technology Administration (RITA), U.S. Department of Transportation (US DOT).
"Automatic Vehicle Location (AVL) systems calculate the real-time location of any vehicle equipped with a Global Positioning Satellite (GPS) receiver. Data are then transmitted to the transit center with use of radio or cellular communications and can be used immediately for daily operations as well as archived for further analysis.
As a stand-alone technology, an AVL system can be used to monitor on-time performance. When combined with other technologies, AVL can deliver many benefits in the areas of fleet management, service planning, safety and security, traveler information, fare payment, vehicle component monitoring, and data collection. Since the greatest benefits from AVL are achieved by combining it with other Intelligent Transportation System (ITS) technologies, AVL is most appropriate for large rural agencies with more than 30 vehicles that plan to implement a comprehensive ITS."
[pcb.its.dot.gov/ factsheets/ avl/ avlRural_ overview.asp]
The vehicular network diagram example "Automatic vehicle location" was created using the ConceptDraw PRO diagramming and vector drawing software extended with the Vehicular Networking solution from the Computer and Networks area of ConceptDraw Solution Park.
Vehicular network diagram
Used Solutions
"Surveillance is the monitoring of the behavior, activities, or other changing information, usually of people for the purpose of influencing, managing, directing, or protecting them. This can include observation from a distance by means of electronic equipment (such as CCTV cameras), or interception of electronically transmitted information (such as Internet traffic or phone calls); and it can include simple, relatively no- or low-technology methods such as human intelligence agents and postal interception. ...
Surveillance is very useful to governments and law enforcement to maintain social control, recognize and monitor threats, and prevent/ investigate criminal activity. With the advent of programs such as the Total Information Awareness program and ADVISE, technologies such as high speed surveillance computers and biometrics software, and laws such as the Communications Assistance For Law Enforcement Act, governments now possess an unprecedented ability to monitor the activities of their subjects." [Surveillance. Wikipedia]
[itl.nist.gov/ iad/ 894.01/ tests/ avss/ 2009/ ]
The example "Camera layout schematic" was created using the ConceptDraw PRO diagramming and vector drawing software extended with the Security and Access Plans solution from the Building Plans area of ConceptDraw Solution Park.
Airport surveillance CCTV cameras layout

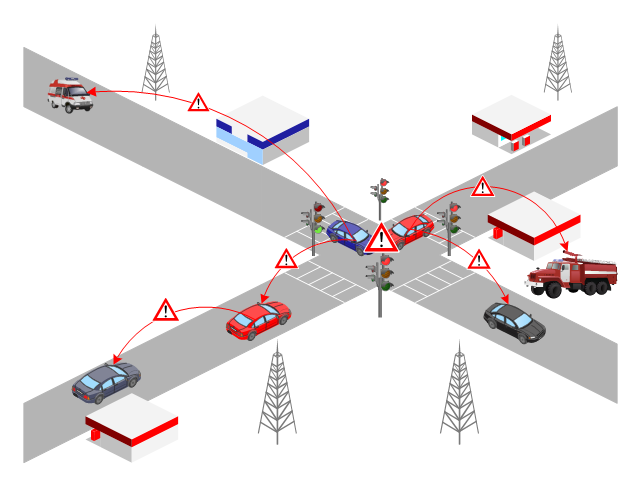
This VANET diagram example was drawn on the base of picture from the webpage "Security and Privacy in Location-based MANETs/ VANETs" from the Donald Bren School of Information and Computer Sciences, the University of California, Irvine. [ics.uci.edu/ ~keldefra/ manet.htm]
"A vehicular ad hoc network (VANET) uses cars as mobile nodes in a MANET to create a mobile network. A VANET turns every participating car into a wireless router or node, allowing cars approximately 100 to 300 metres of each other to connect and, in turn, create a network with a wide range. As cars fall out of the signal range and drop out of the network, other cars can join in, connecting vehicles to one another so that a mobile Internet is created. It is estimated that the first systems that will integrate this technology are police and fire vehicles to communicate with each other for safety purposes. Automotive companies like General Motors, Toyota, Nissan, DaimlerChrysler, BMW and Ford promote this term." [Vehicular ad hoc network. Wikipedia]
The VANET diagram example "Vehicular ad-hoc network" was created using the ConceptDraw PRO diagramming and vector drawing software extended with the Vehicular Networking solution from the Computer and Networks area of ConceptDraw Solution Park.
VANET diagram
Used Solutions
Maps
>
 PM Dashboards
This solution extends ConceptDraw PRO and ConceptDraw PROJECT software with the ability to clearly display the identified key performance indicators for any project.
 Software Development Area
Solutions from the Software Development Area of ConceptDraw Solution Park collect templates, samples and libraries of vector stencils for drawing the software engineering diagrams and user interface design prototypes.
How to Build a Flowchart

Learn the basics of flowcharting and see how to build create a flowchart using ConceptDraw automatic drawing tools.
Azure Management

ConceptDraw PRO diagramming and vector drawing software enhanced with Azure Architecture Solution from the Computer and Networks area of ConceptDraw Solution Park offers all needed tools for designing Azure management illustrations and Azure Architecture Diagrams.
- Process Flowchart | Information systems in the schools | Design ...
- Enterprise Architecture Diagrams | Network Diagram Software ...
- Camera layout schematic | Marketing Diagrams | Computers and ...
- Design elements - Office | Office - Design Elements | Cisco Security ...
- Performance Indicators | What is a KPI? | Enterprise dashboard ...
- Enterprise Architecture Diagrams | Network Diagram Software ...
- Design elements - HR department | HR Flowcharts | Human ...
- 5 Level pyramid model diagram - Information systems types | 4 Level ...
- Types of Flowcharts | Design elements - Meter indicators | Control ...
- Pyramid Diagram | 4 Level pyramid model diagram - Information ...
- Enterprise dashboard | Design elements - Meter indicators ...
- Enterprise dashboard | HR Flowcharts | KPI Dashboard | Human ...
- 4 Level pyramid model diagram - Information systems types ...
- 4 Level pyramid model diagram - Information systems types ...
- 4 Level pyramid model diagram - Information systems types | Types ...
- Enterprise dashboard | KPI Dashboard | How to Connect a Live ...
- Performance Indicators | Constant improvement of key performance ...
- Pyramid Model Of Information Security System
- How to Create a CCTV Diagram in ConceptDraw PRO | Security and ...
- Enterprise dashboard | Dashboard | Graphical Presentation Of ...