HelpDesk
How to Connect an Image to a Topic in Your Mind Map

HelpDesk
How to Create a Custom Library

Export from ConceptDraw DIAGRAM Document to a Graphic File


Basic Flowchart Images. Flowchart Examples

The vector stencils library "Android system icons - image" contains 137 system icons of image processing.
Use this icon set to design user interface of your Android application.
The icons example "Design elements - Android system icons (image)" was created using the ConceptDraw PRO diagramming and vector drawing software extended with the "Android 5 UI" solution from the "Software Development" area of ConceptDraw Solution Park.
System icons of image processing
HelpDesk
How to Get Images for Project Presentation on macOS

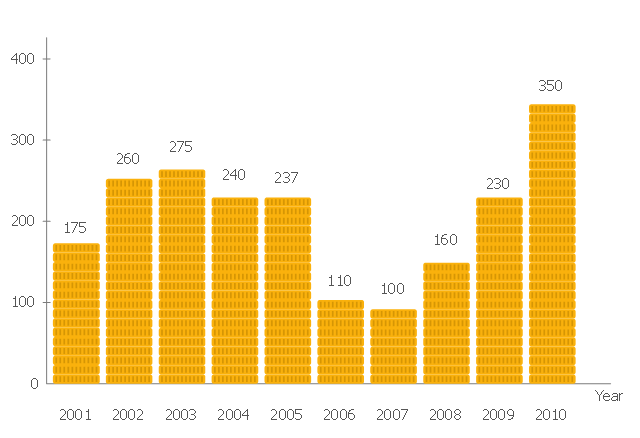
This image graph sample shows the total financing of the Philippines from 2001-2010. This pictorial bar chart was designed on the base of the Wikimedia Commons file: Financing-Total.png. [commons.wikimedia.org/ wiki/ File:Financing-Total.png]
This file is licensed under the Creative Commons Attribution-Share Alike 3.0 Unported license. [creativecommons.org/ licenses/ by-sa/ 3.0/ deed.en]
"The Economy of the Philippines is the 40th largest in the world, according to 2012 International Monetary Fund statistics, and is also one of the emerging markets in the world. The Philippines is considered as a newly industrialized country, which has been transitioning from being one based on agriculture to one based more on services and manufacturing. According to the World Bank ICP 2011, the estimated 2011 GDP (purchasing power parity) was $543.7 billion." [Economy of the Philippines. Wikipedia]
The image chart example "The total financing of the Philippines from 2001-2010" was created using the ConceptDraw PRO diagramming and vector drawing software extended with the Marketing Diagrams solution from the Marketing area of ConceptDraw Solution Park.
Marketing graph
HelpDesk
How to Save a Drawing as a Graphic File
Local area network (LAN). Computer and Network Examples
 diagram")

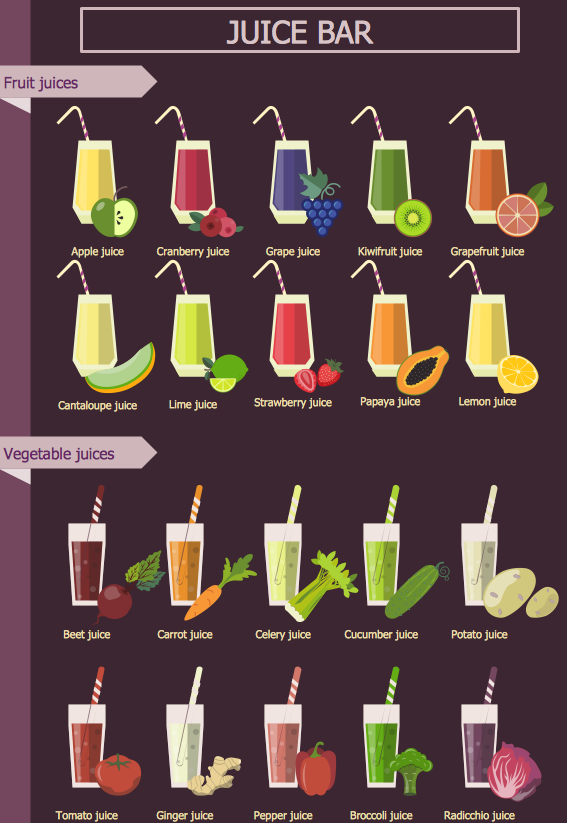
Pictures of Vegetables
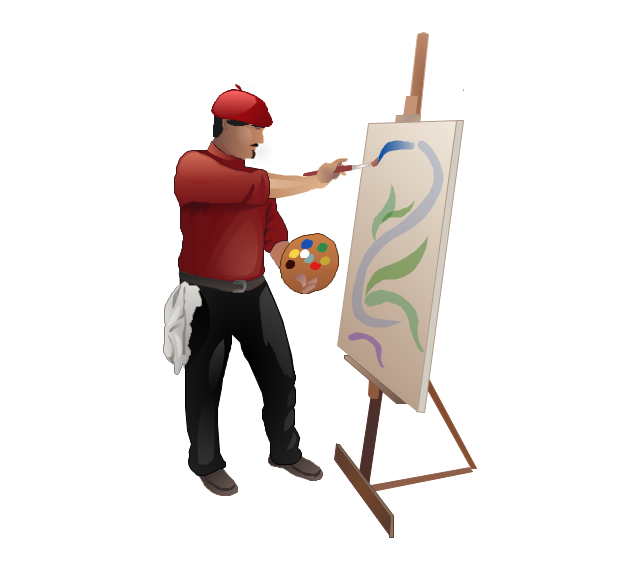
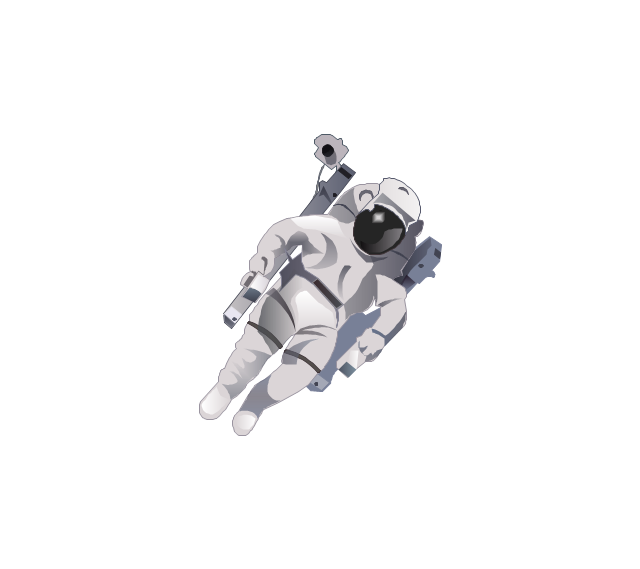
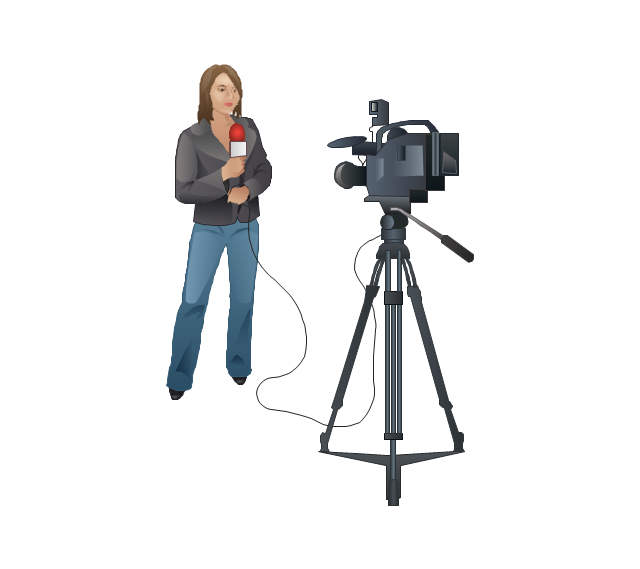
The vector stencils library "Professions" contains 58 people clipart images of different professions you can use in your presentations, illustrations and infographics.
"Electronic clip art is available in several different file formats. It is important for clip art users to understand the differences between file formats so that they can use an appropriate image file and get the resolution and detail results they need.
Clip art file formats are divided into 2 different types: bitmap or vector graphics. ...
In contrast to the grid format of bitmap images, Vector graphics file formats use geometric modeling to describe an image as a series of points, lines, curves, and polygons. Because the image is described using geometric data instead of fixed pixels, the image can be scaled to any size while retaining "resolution independence", meaning that the image can be printed at the highest resolution a printer supports, resulting in a clear, crisp image. Vector file formats are usually superior in resolution and ease of editing as compared to bitmap file formats, but are not as widely supported by software and are not well-suited for storing pixel-specific data such as scanned photographs. In the early years of electronic clip art, vector illustrations were limited to simple line art representations." [Clip art. Wikipedia]
The clip art example "Professions - Vector stencils library" was created using the ConceptDraw PRO diagramming and vector drawing software extended with the People solution from the Illustration area of ConceptDraw Solution Park.
www.conceptdraw.com/ solution-park/ illustrations-people
Builder 1

System administrator

Worker of conveyor

Clerk 1

Clerk 2

Student 2

Student 3

Student 1

Dispatcher 1

Accountant

Gardener

Lawyer

Jurist

Judge

Consultant

Manager

Director

Programmer

Architect

Pilot

Policeman

Secretary

Security officer

Clerk 3

Musician

Presenter

Athlete

Artist
Announcer

Photographer

Hairdresser

Florist

Spaceman
Engineer

Reporter
Tailor

Dispatcher 2

Biologist

Chemist

Dentist

Priest

Soldier

Doctor

Driver

Carpenter

Fireman

Seaman

Builder 2

Postman

Miner

Waiter

Cleaner

Cashier

Shop assistant

Cook

Flight attendant

Teacher

Hall porter

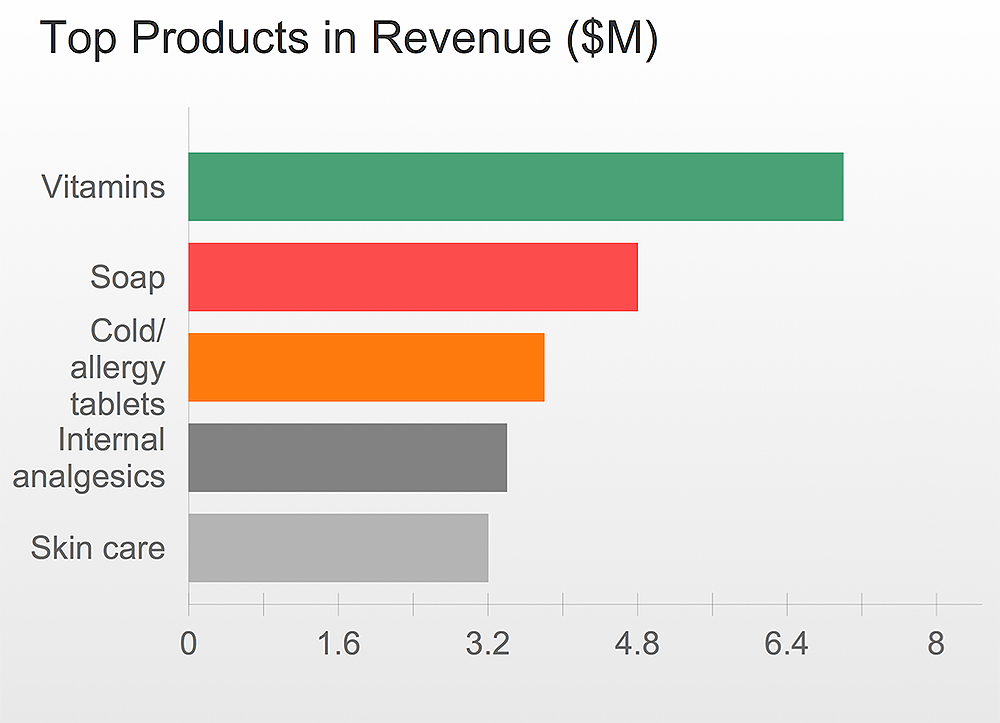
This pictorial chart sample shows the population growth by continent in 2010-2013.
"Population growth' refers to the growth in human populations. Global population growth is around 80 million annually, or 1.2% p.a. The global population has grown from 1 billion in 1800 to 7 billion in 2012. It is expected to keep growing to reach 11 billion by the end of the century. Most of the growth occurs in the nations with the most poverty, showing the direct link between high population growth and low standards of living. The nations with high standards of living generally have low or zero rates of population growth. Australia's population growth is around 400,000 annually, or 1.8% p.a., which is nearly double the global average. It is caused mainly by very high immigration of around 200,000 p.a., the highest immigration rate in the world. Australia remains the only nation in the world with both high population growth and high standards of living." [Population growth. Wikipedia]
The image chart example "Population growth by continent, 2010 - 2013" was created using the ConceptDraw PRO diagramming and vector drawing software extended with the Basic Picture Graphs solution from the Graphs and Charts area of ConceptDraw Solution Park.
Image chart

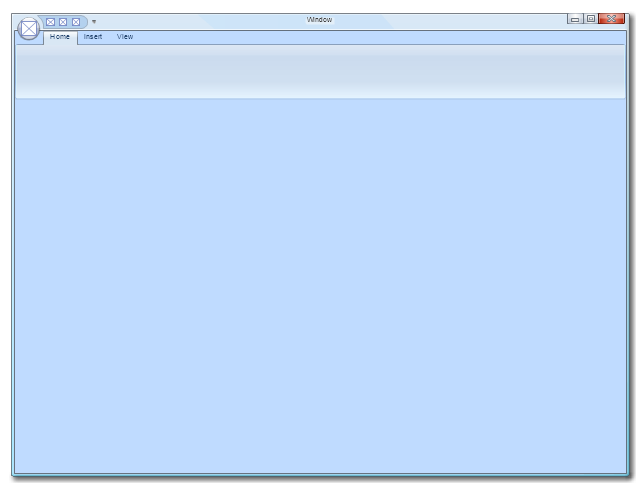
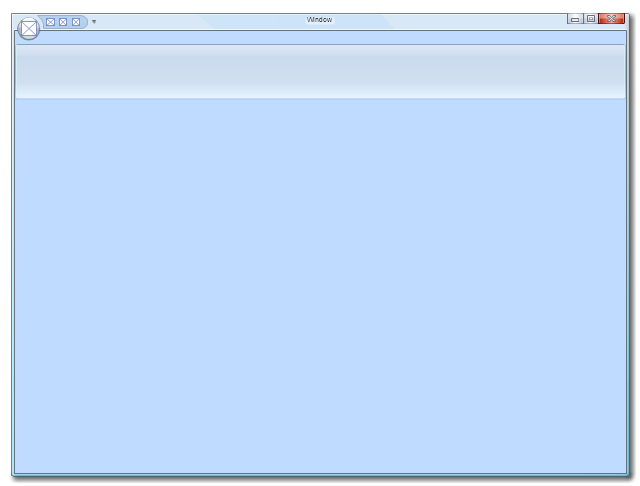
The vector stencils library "Ribbon interface" contains 41 ribbon shapes.
Use it for designing Microsoft ribbon graphic user interface (GUI) of software for Windows computers in the ConceptDraw PRO diagramming and vector drawing software extended with the Graphic User Interface solution from the Software Development area of ConceptDraw Solution Park.
Use it for designing Microsoft ribbon graphic user interface (GUI) of software for Windows computers in the ConceptDraw PRO diagramming and vector drawing software extended with the Graphic User Interface solution from the Software Development area of ConceptDraw Solution Park.
Main Window with Menu
Main Window
Menu

Special Menu

Field

Tools Group

Tools Group Minimized

Tool Button

Tool Button

Toolbar

Label

Text Label

Edit Box

Combobox

Combobox with List
Drop-down Menu
Spin Box

Check Box

Radio Button

Styles Control 1

Styles Control 2

Rounded Tab

Floating Dialogue

Status Bar

Small Toolbar (for Status Bar)
-ribbon-interface---vector-stencils-library.png--diagram-flowchart-example.png)
Zoom Slider

Horizontal Scroll

Vertical Scroll
Drop-down List

Arrow
Close

Drop-down Menu Base

Drop-down Menu Left Part

Menu/List Item (Text)
-ribbon-interface---vector-stencils-library.png--diagram-flowchart-example.png)
Menu/List Item (Image)
-ribbon-interface---vector-stencils-library.png--diagram-flowchart-example.png)
Menu/List Item (Image with Text)
-ribbon-interface---vector-stencils-library.png--diagram-flowchart-example.png)
Meny/List Header

Drop-down Menu Separator

Vertical Separator

Chek/Option for Drop-down Menu

Image

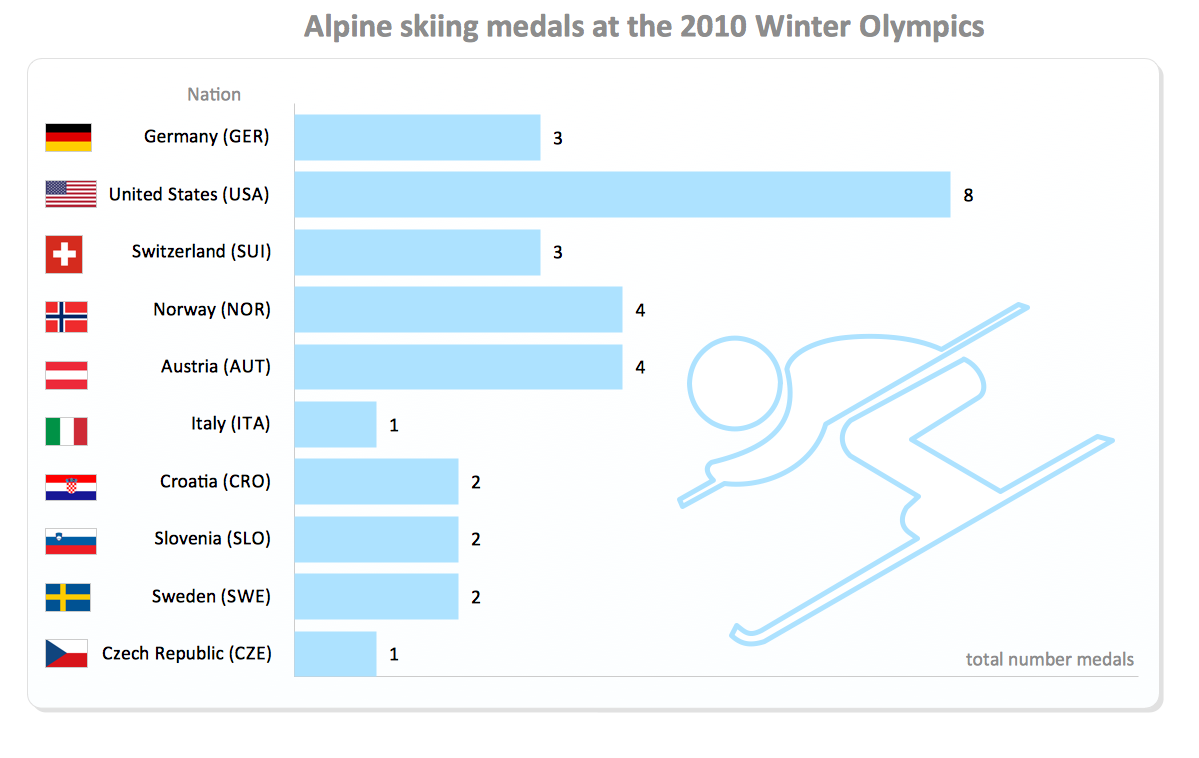
Winter Sports. Illustrations and Visualize Statistics
BPR Diagram. Business Process Reengineering Example

- Healthy Diet Plan | Healthy Diet | Food Pictures | Image Of Balance ...
- Image Of Network Topology
- Biology | Biology Illustration | Glycolysis Cycle Hd Image
- Chart Maker for Presentations | Line Graph | Picture Graph | Image ...
- Image Enhancement Project With All Uml Diagrams
- Object Diagram For Image Processing System
- Rainfall Bar Chart | Bar Graph | Picture Graphs | Bar Graph Image ...
- Sport Field Plans | Volleyball Ground Plan Image
- Solar System Drawing Image
- Dfd For Image Processing Project
- Kreb Cycle Image
- How to Connect an Image to a Topic in Your Mind Map | How to ...
- Image Of Graphical User Interface
- Glyphicon Chevron Down Png Image
- Data Flow Diagram For Image Processing
- Entity Relationship Diagram Of Voting System Image
- Basic Flowchart Images . Flowchart Examples | Basic Flowchart ...
- Www All Mahadeep Image Com
- Images Of A Football Field Numbers With Their Positions Of Players
- Uml Diagrams Of Image Processing