This TQM diagram example was redesigned from the illustration of the Highway Performance Monitoring System (HPMS) Field Manual from the website of the Federal Highway Administration (FHWA).
[fhwa.dot.gov/ policyinformation/ hpms/ fieldmanual/ chapter7.cfm]
"Highway Performance Monitoring System (HPMS).
The HPMS is a national level highway information system that includes data on the extent, condition, performance, use and operating characteristics of the nation's highways. The HPMS contains administrative and extent of system information on all public roads, while information on other characteristics is represented in HPMS as a mix of universe and sample data for arterial and collector functional systems. Limited information on travel and paved miles is included in summary form for the lowest functional systems.
HPMS was developed in 1978 as a continuing database, replacing the special biennial condition studies that had been conducted since 1965. The HPMS has been modified several times since its inception. Changes have been made to reflect changes in the highway systems, legislation, and national priorities, to reflect new technology, and to consolidate or streamline reporting requirements." [fhwa.dot.gov/ policyinformation/ hpms.cfm]
The TQM flowchart example "Software workflow diagram" was created using the ConceptDraw PRO diagramming and vector drawing software extended with the Total Quality Management (TQM) Diagrams solution from the Quality area of ConceptDraw Solution Park.
TQM diagram

Money - Design Elements

TQM Diagram — Professional Total Quality Management

Create TQM Flowcharts for Mac

Process Flowchart


Identifying Quality Management System

This TQM diagram sample was redesigned from the illustration of "Inland acid sulfate soil and water quality fact sheet" from website of the Department of the Environment of the Australian Government.
[environment.gov.au/ resource/ inland-acid-sulfate-soil-and-water-quality-fact-sheet]
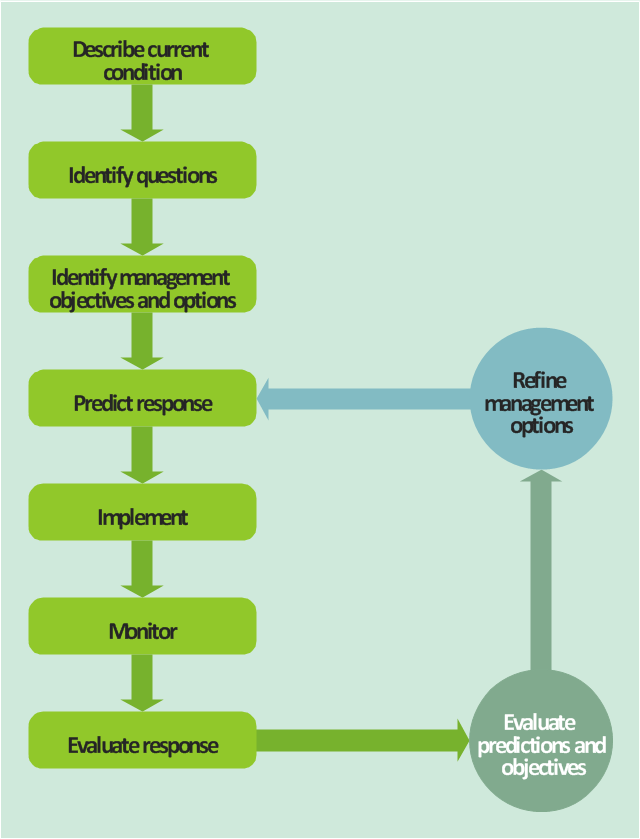
"Adaptive management (AM), also known as adaptive resource management (ARM), is a structured, iterative process of robust decision making in the face of uncertainty, with an aim to reducing uncertainty over time via system monitoring. In this way, decision making simultaneously meets one or more resource management objectives and, either passively or actively, accrues information needed to improve future management. Adaptive management is a tool which should be used not only to change a system, but also to learn about the system (Holling 1978). Because adaptive management is based on a learning process, it improves long-run management outcomes. The challenge in using the adaptive management approach lies in finding the correct balance between gaining knowledge to improve management in the future and achieving the best short-term outcome based on current knowledge (Allan & Stankey 2009)." [Adaptive management. Wikipedia]
The TQM flowchart example "Acid sulfate soil adaptive management framework" was created using the ConceptDraw PRO diagramming and vector drawing software extended with the Total Quality Management (TQM) Diagrams solution from the Quality area of ConceptDraw Solution Park.
[environment.gov.au/ resource/ inland-acid-sulfate-soil-and-water-quality-fact-sheet]
"Adaptive management (AM), also known as adaptive resource management (ARM), is a structured, iterative process of robust decision making in the face of uncertainty, with an aim to reducing uncertainty over time via system monitoring. In this way, decision making simultaneously meets one or more resource management objectives and, either passively or actively, accrues information needed to improve future management. Adaptive management is a tool which should be used not only to change a system, but also to learn about the system (Holling 1978). Because adaptive management is based on a learning process, it improves long-run management outcomes. The challenge in using the adaptive management approach lies in finding the correct balance between gaining knowledge to improve management in the future and achieving the best short-term outcome based on current knowledge (Allan & Stankey 2009)." [Adaptive management. Wikipedia]
The TQM flowchart example "Acid sulfate soil adaptive management framework" was created using the ConceptDraw PRO diagramming and vector drawing software extended with the Total Quality Management (TQM) Diagrams solution from the Quality area of ConceptDraw Solution Park.
TQM diagram
TQM Software — Build Professional TQM Diagrams

Total Quality Management

TQM Diagram Example

 Total Quality Management TQM Diagrams
Total Quality Management Diagrams solution extends ConceptDraw PRO software with samples, templates and vector stencils library for drawing the TQM flowcharts.
Biology Illustration

 Illustration Area
Solutions from the Illustrations Area of ConceptDraw Solution Park collect templates, samples and libraries of color scalable vector stencils, icons and clip art for illustrating documents, presentations, infographics, web sites and blogs.
Business Diagram Software


Quality Control Chart Software — ISO Flowcharting

- TQM Diagram Example | TQM Software — Build Professional TQM ...
- Illustration Of Total Quality Management
- Tqm Graph Illustration
- Total Quality Management TQM Diagrams | Software workflow ...
- Graphs Diagrams And Pictures That Can Show Tqm Clearly
- Operational Model Of Tqm
- Presentation Clipart | Total Quality Management TQM Diagrams ...
- Astronomy | Total Quality Management TQM Diagrams | Rapid UML ...
- Total Quality Management TQM Diagrams | Visual Presentations ...
- Tqm Model Diagram And Explanation
- Draw Model Of Tqm
- Images Of Graphs Showing Total Quality Management
- Needs Of Tqm In Libraries
- Fishbone Diagram | Total Quality Management TQM Diagrams ...
- Business and Finance Illustrations Example | Mathematics | How ...
- Seven Management and Planning Tools | Total Quality Management ...
- Cause and Effect Analysis - Fishbone Diagrams for Problem Solving ...
- TQM Diagram Tool | Process Flowchart | Basic Diagramming ...
- Example For A Tqm Flowchart
- Organizational Structure | Matrix Organization Structure ...