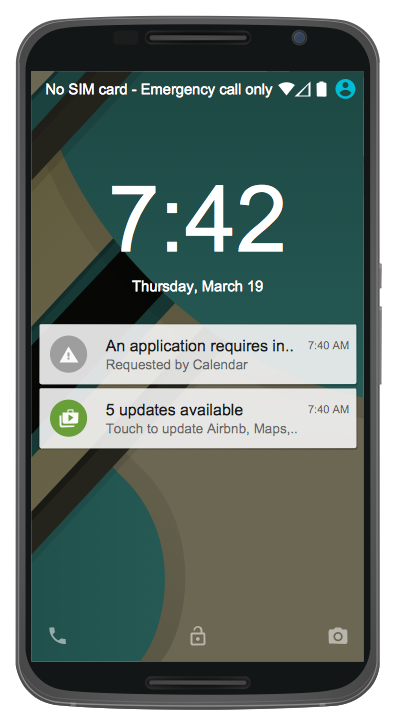
"The interface is based around the home screen, a graphical list of available applications. iPhone applications normally run one at a time. Starting with the iPhone 4, a primitive version of multitasking came into play. Users could double click the home button to select recently opened. However, the apps never ran in the background. Starting with iOS 7, though, apps can truly multitask, and each open application runs in the background when not in use, although most functionality is still available when making a call or listening to music. The home screen can be accessed at any time by a hardware button below the screen, closing the open application in the process.
By default, the Home screen contains the following icons: Messages (SMS and MMS messaging), Calendar, Photos, Camera, YouTube, Stocks, Maps (Google Maps), Weather, Voice Memos, Notes, Clock, Calculator, Settings, iTunes (store), App Store, (on the iPhone 3GS and iPhone 4) Compass, FaceTime and GameCenter were added in iOS 4.0 and 4.1 respectively. In iOS 5, Reminders and Newsstand were added, as well as the iPod application split into separate Music and Videos applications. iOS 6 added Passbook as well as an updated version of Maps that relies on data provided by TomTom as well as other sources. iOS 6 also added a Clock application onto the iPad's homescreen. However, it also no longer support YouTube. Docked at the base of the screen, four icons for Phone, Mail, Safari (Internet), and Music delineate the iPhone's main purposes. On January 15, 2008, Apple released software update 1.1.3, allowing users to create "Web Clips", home screen icons that resemble apps that open a user-defined page in Safari. After the update, iPhone users can rearrange and place icons on up to nine other adjacent home screens, accessed by a horizontal swipe." [iPhone. Wikipedia]
The example "iPhone OS (iOS) graphic user interface (GUI) - Alarm setting" was created using the ConceptDraw PRO diagramming and vector drawing software extended with the Graphic User Interface solution from the Software Development area of ConceptDraw Solution Park.
iPhone GUI
-graphic-user-interface-(gui)---alarm-setting.png--diagram-flowchart-example.png)
ERD Symbols and Meanings


Android UI Design
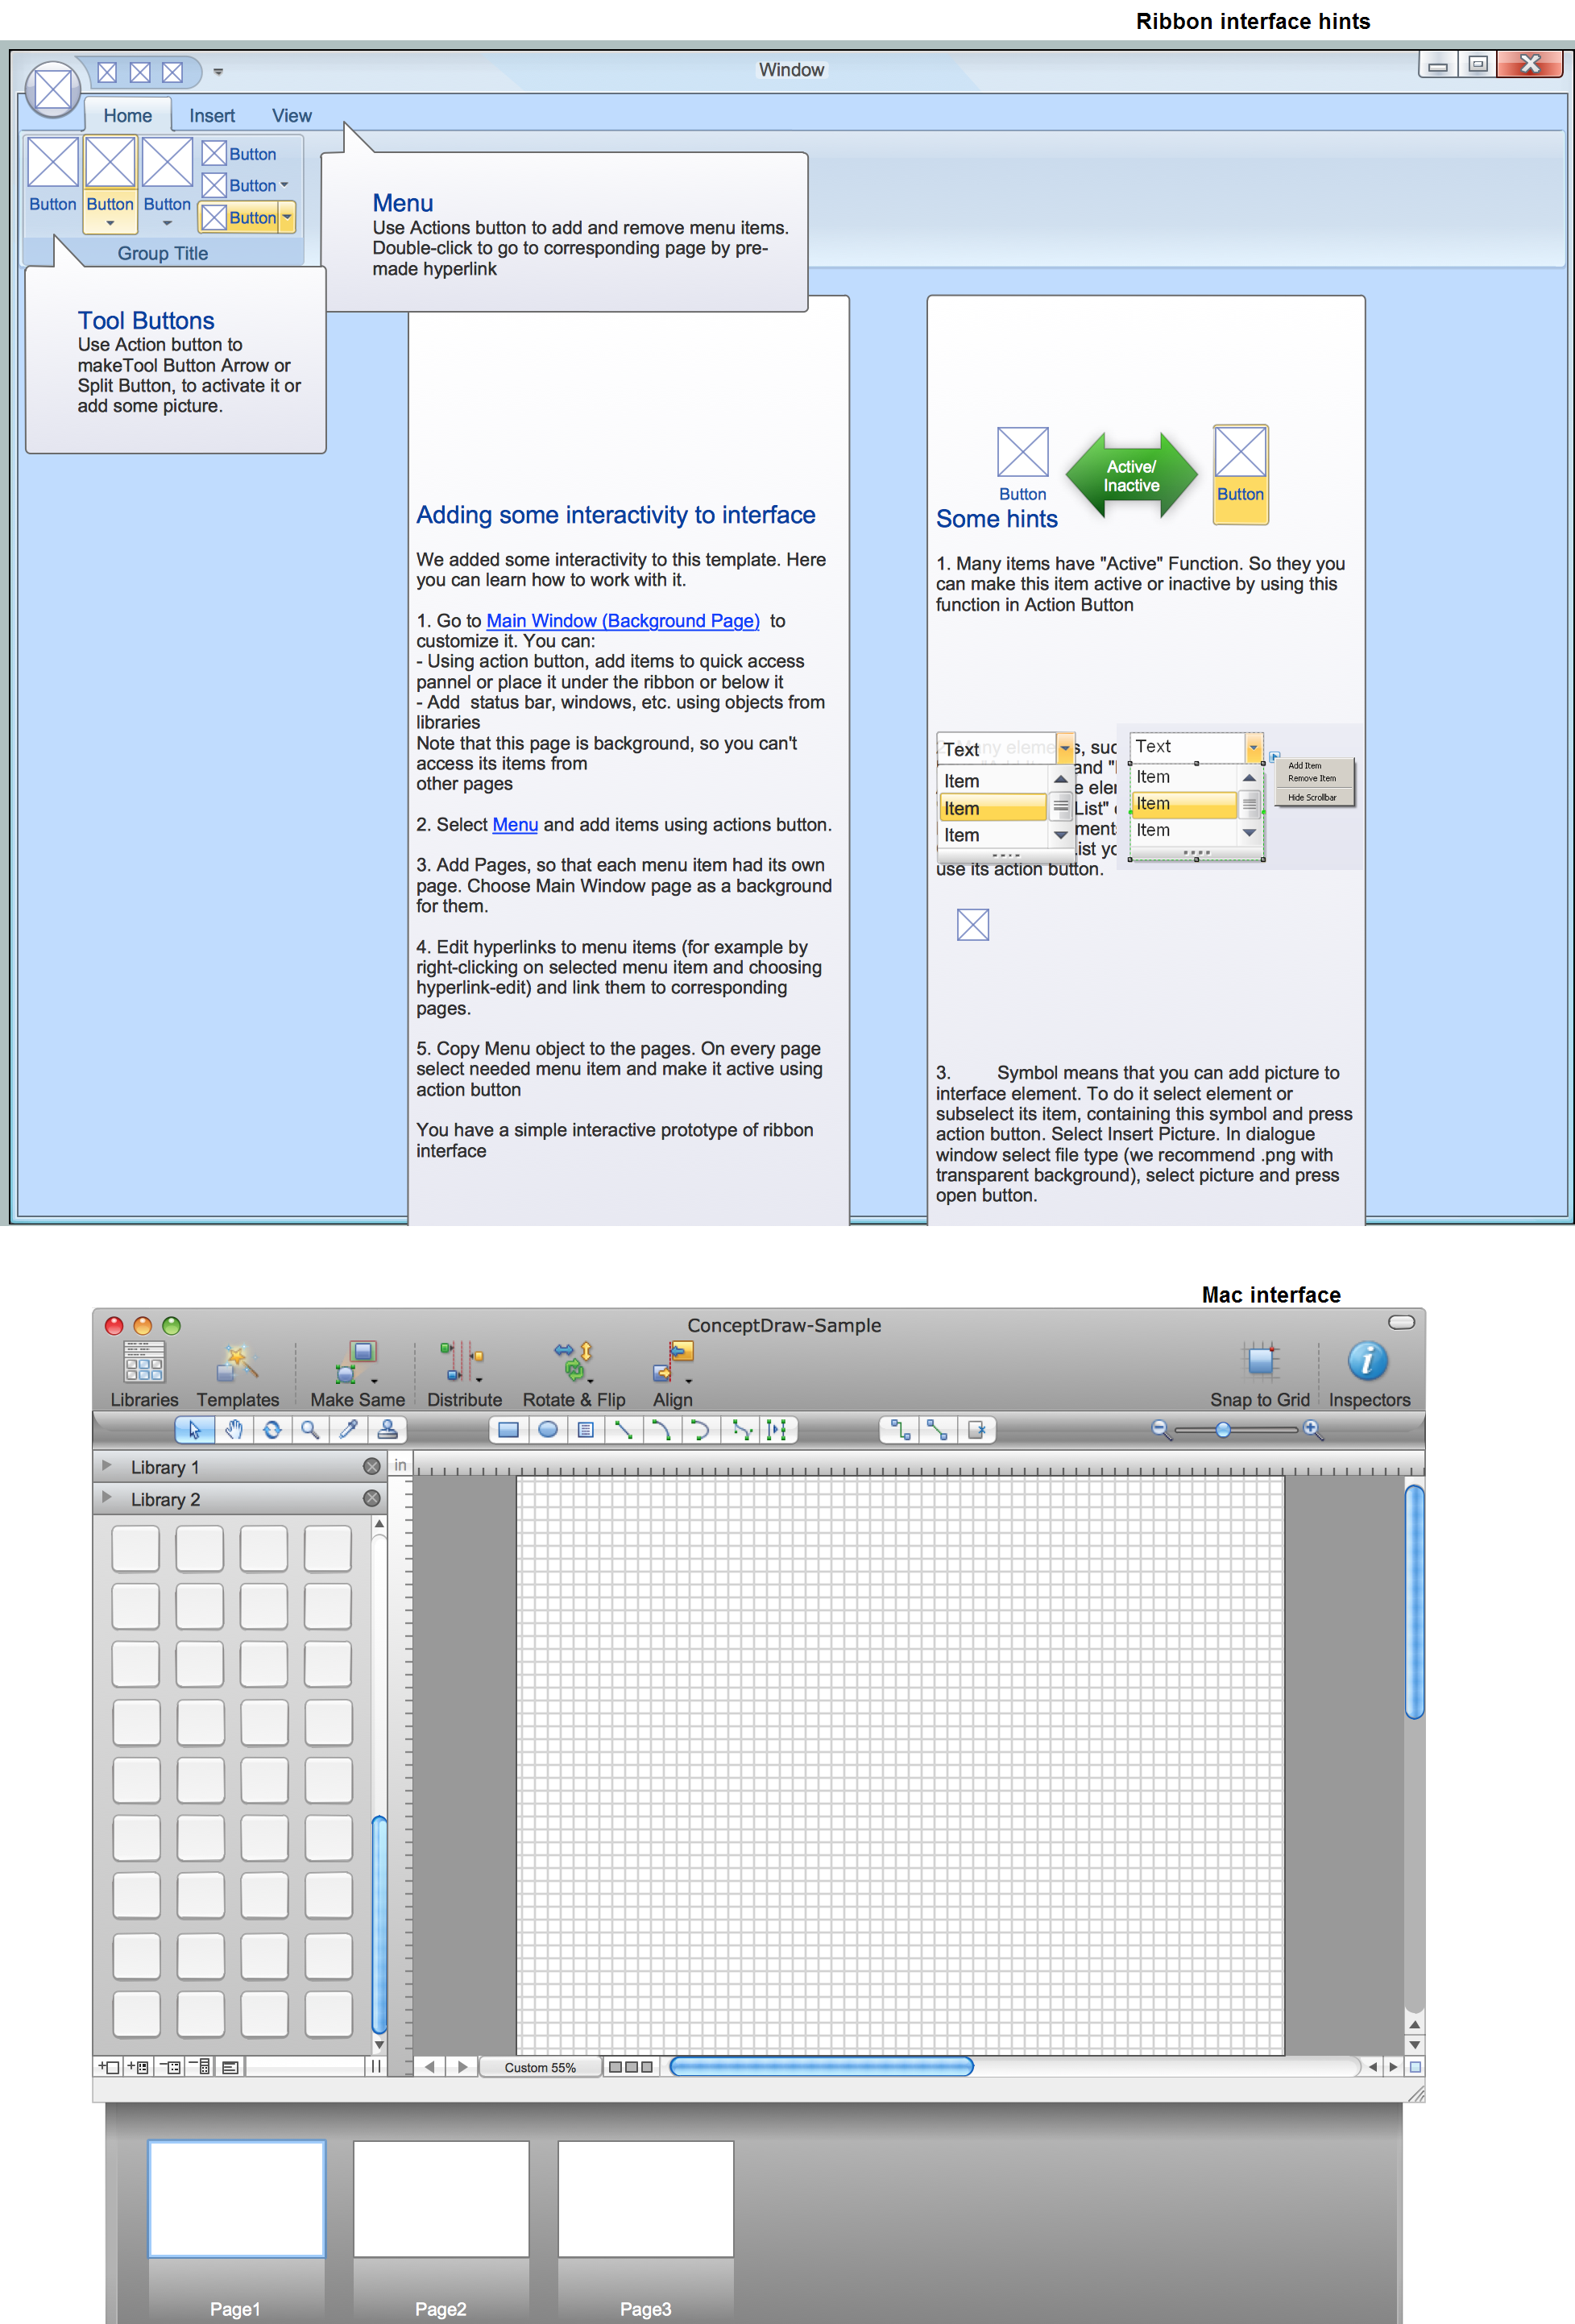
GUI Prototyping with ConceptDraw DIAGRAM
Android GUI
Graphical User Interface Examples

 Android User Interface
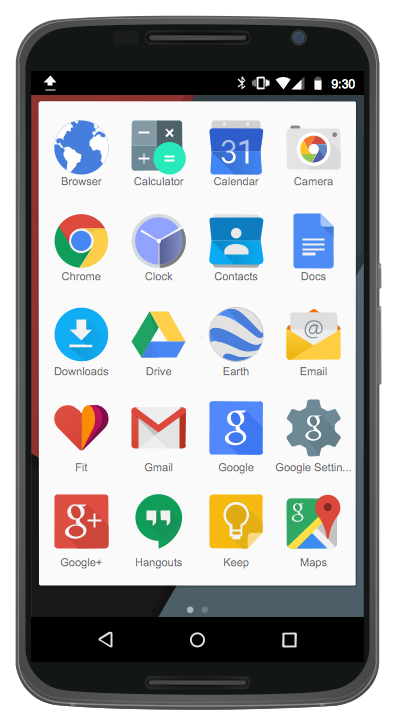
The Android User Interface solution allows ConceptDraw DIAGRAM act as an Android UI design tool. Libraries and templates contain a variety of Android GUI elements to help users create images based on Android UI design.
GUI Software
 Windows 10 User Interface
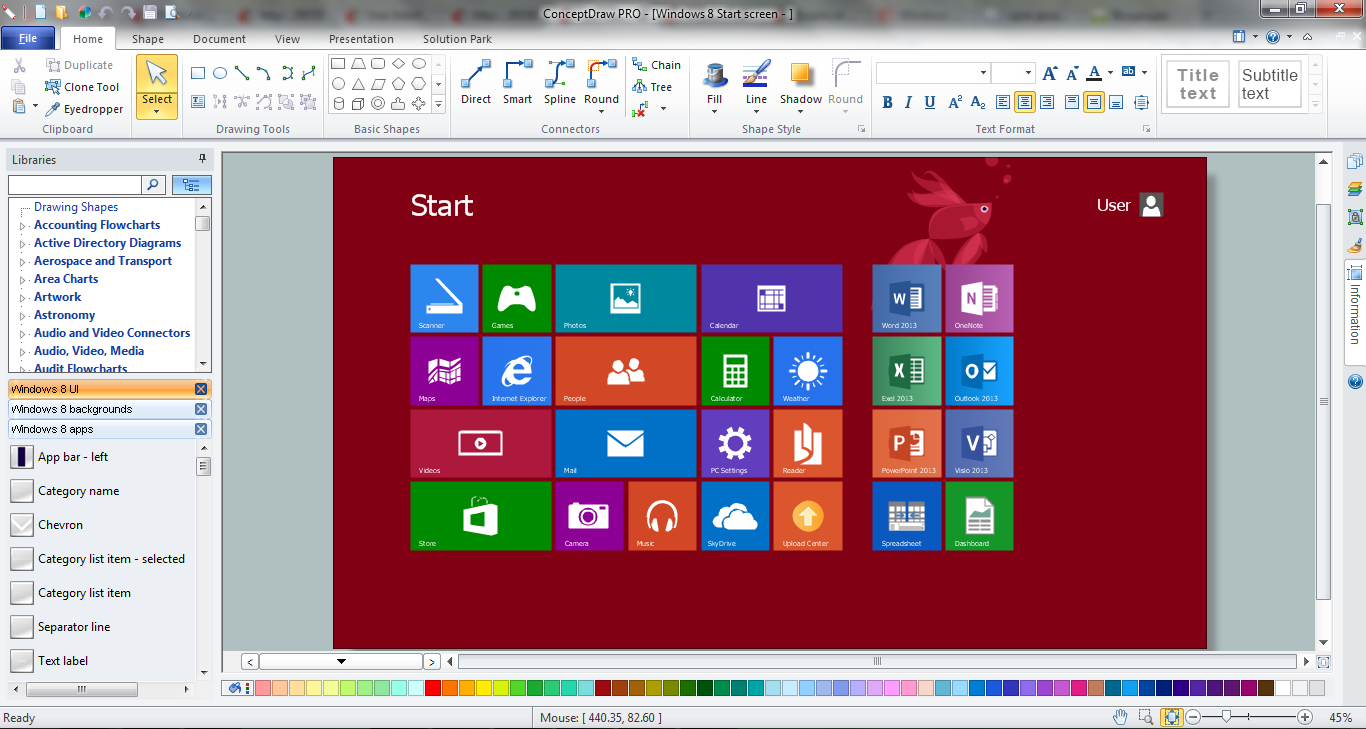
Windows 10 User Interface solution extends significantly ConceptDraw DIAGRAM functionality with look-and-feel functions of GUI software and makes it a great assistant for Win10 designers, developers, and software engineers. This solution provides a wide s
 Plant Layout Plans
Plant Layout Plans solution can be used for power plant design and plant layout design, for making the needed building plant plans and plant layouts looking professionally good. Having the newest plant layout software, the plant design solutions and in particular the ConceptDraw’s Plant Layout Plans solution, including the pre-made templates, examples of the plant layout plans, and the stencil libraries with the design elements, the architects, electricians, interior designers, builders, telecommunications managers, plant design engineers, and other technicians can use them to create the professionally looking drawings within only a few minutes.
 Fault Tree Analysis Diagrams
This solution extends ConceptDraw DIAGRAM.5 or later with templates, fault tree analysis example, samples and a library of vector design elements for drawing FTA diagrams (or negative analytical trees), cause and effect diagrams and fault tree diagrams.
 Computer and Network Package
Computer and Network Package is a large set of valuable graphical solutions from ConceptDraw Solution Park, developed and specially selected to help computer network specialists and IT professionals to realize their daily work the most efficiently and quickly. This package contains extensive set of graphic design tools, ready-to-use vector elements, built-in templates and samples for designing professional-looking diagrams, charts, schematics and infographics in a field of computer network technologies, cloud computing, vehicular networking, wireless networking, ensuring networks security and networks protection. It is useful for designing different floor plans and layout plans for homes, offices, hotels and instantly construction detailed schemes of computer networks and wireless networks on them, for making professional-looking and colorful Pie Charts, Bar Graphs and Line Charts visualizing the relevant information and data.
- Delete Calculator Icon Png
- Ios Memo Icon Png
- App icons - Vector stencils library | iPhone OS ( iOS ) graphic user ...
- Ios 9 Clock Icon Png
- Icon Videos Iphone 6 Png
- Reminders - Template | iPhone User Interface | How to Send Task ...
- Music Memos Icons For Phones Images Png Hd
- Icon Ios Png
- Camera Icon Ipod Png
- Icon Iphone 6 Png
- iPhone User Interface | App icons - Vector stencils library | Design ...
- App icons - Vector stencils library | Application - Vector stencils ...
- Iphone 5s Mail Icon Png
- iPhone User Interface | Contact Card | Design elements - Apps icons ...
- App Setting Icons Png
- Reminders Png Icon
- Ios Safari Icon Png
- Iphone Messaging Icon Png
- Reminders Icon Iphone Png
- Ios Ipad Status Bar Png Transparent