HR infographics "Electronic human resources (E-HR)" was redesigned from the Wikimedia Commons file: Ehr diagram.jpg. [commons.wikimedia.org/ wiki/ File:Ehr_ diagram.jpg]
This file is licensed under the Creative Commons Attribution-Share Alike 3.0 Unported license. [creativecommons.org/ licenses/ by-sa/ 3.0/ ]
"E-HR is a function of HR that is concerned with the use, management, and regulation of electronic information and processes within an organization.
E-HR is different from E-HRM (Electronic Human Resource Management) and HRIS (Human Resource Information System) which are uses of technology. More specifically, E-HRM is a system that allows management and employees access to human resource related information and services through an organization's intranet or web portal. HRIS refers to enterprise resource planning software that streamlines human resource functions such as payroll.
In contrast, E-HR is a function of human resources that requires cross-functional knowledge and collaboration between multiple departments, most notably human resources and information technology." [Electronic human resources. Wikipedia]
The HR infographics example "Electronic human resources (E-HR)" was created using the ConceptDraw PRO diagramming and vector drawing software extended with the HR Flowcharts solution from the Management area of ConceptDraw Solution Park.
HR infographics
.png--diagram-flowchart-example.png)
Used Solutions
HR infographics "Components of competency based management" was redesigned from the Wikipedia file: Competency-circle.jpg. [en.wikipedia.org/ wiki/ File:Competency-circle.jpg]
This file is licensed under the Creative Commons Attribution-ShareAlike 3.0 License. [creativecommons.org/ licenses/ by-sa/ 3.0/ ]
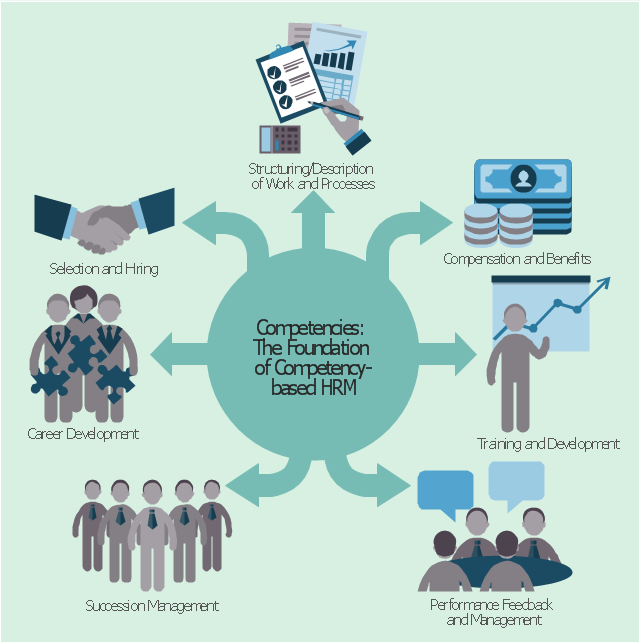
"Competency-based human resources planning serves as a link between human resources management and the overall strategic plan of an organization. Competencies are defined as observable abilities, skills, knowledge, motivations or traits defined in terms of the behaviours needed for successful job performance.
Competency-based management supports the integration of human resources planning with business planning by allowing organizations to assess the current human resource capacity based on their competencies against the capacity needed to achieve the vision, mission and business goals of the organization. Targeted human resource strategies, plans and programs to address gaps (e.g., hiring and staffing; learning; career development; succession management; etc.) are then designed, developed and implemented to close the gaps." [Competency-based management. Wikipedia]
The HR infographics example "Components of competency based management" was created using the ConceptDraw PRO diagramming and vector drawing software extended with the HR Flowcharts solution from the Management area of ConceptDraw Solution Park.
This file is licensed under the Creative Commons Attribution-ShareAlike 3.0 License. [creativecommons.org/ licenses/ by-sa/ 3.0/ ]
"Competency-based human resources planning serves as a link between human resources management and the overall strategic plan of an organization. Competencies are defined as observable abilities, skills, knowledge, motivations or traits defined in terms of the behaviours needed for successful job performance.
Competency-based management supports the integration of human resources planning with business planning by allowing organizations to assess the current human resource capacity based on their competencies against the capacity needed to achieve the vision, mission and business goals of the organization. Targeted human resource strategies, plans and programs to address gaps (e.g., hiring and staffing; learning; career development; succession management; etc.) are then designed, developed and implemented to close the gaps." [Competency-based management. Wikipedia]
The HR infographics example "Components of competency based management" was created using the ConceptDraw PRO diagramming and vector drawing software extended with the HR Flowcharts solution from the Management area of ConceptDraw Solution Park.
HR Infographics
HR infographics "Talent management process" was redesigned from the Wikimedia Commons file: Model_ TM.jpg. [commons.wikimedia.org/ wiki/ File:Model_ TM.jpg]
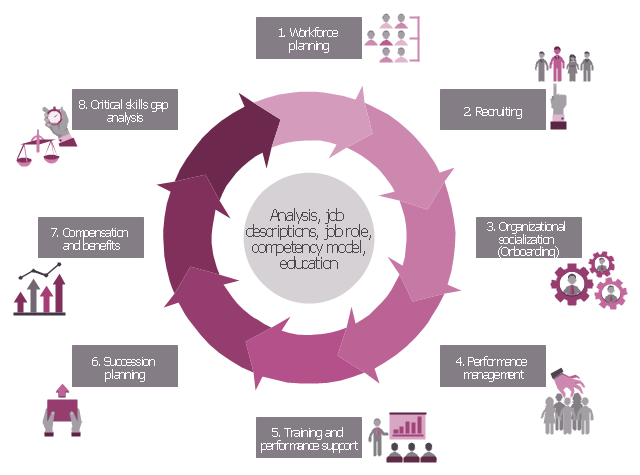
"Talent management refers to the anticipation of required human capital for an organization and the planning to meet those needs. ...
Talent management is the science of using strategic human resource planning to improve business value and to make it possible for companies and organizations to reach their goals. Everything done to recruit, retain, develop, reward and make people perform forms a part of talent management as well as strategic workforce planning. A talent-management strategy needs to link to business strategy to make sense." [Talent management. Wikipedia]
The HR infographics example "Talent management process" was created using the ConceptDraw PRO diagramming and vector drawing software extended with the HR Flowcharts solution from the Management area of ConceptDraw Solution Park.
HR infographics
Pyramid Diagram

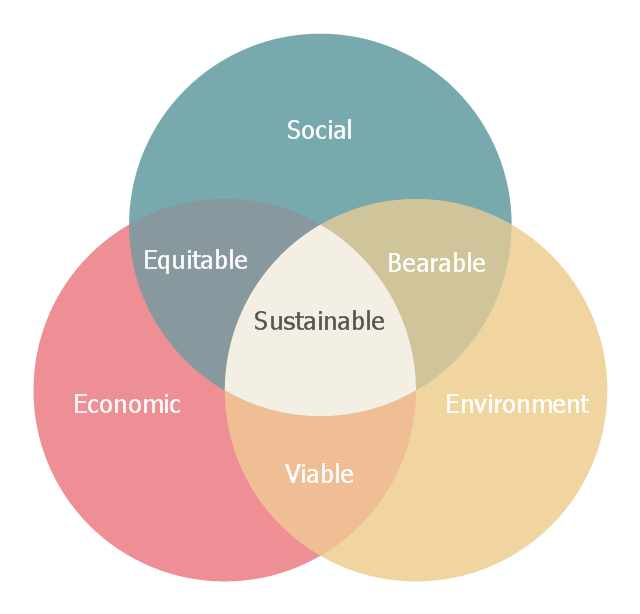
This Venn diagram sample shows the sustainable development at the confluence of three constituent parts: social, economic and environment. It was designed on the base of the Wikimedia Commons file: Sustainable development.svg.
[commons.wikimedia.org/ wiki/ File:Sustainable_ development.svg]
This file is licensed under the Creative Commons Attribution-Share Alike 3.0 Unported license. [creativecommons.org/ licenses/ by-sa/ 3.0/ deed.en]
"Sustainable development is an organizing principle for human life on a finite planet. It posits a desirable future state for human societies in which living conditions and resource-use meet human needs without undermining the sustainability of natural systems and the environment, so that future generations may also have their needs met.
Sustainable development ties together concern for the carrying capacity of natural systems with the social and economic challenges faced by humanity. " [Sustainable development. Wikipedia]
The Venn diagram example "Sustainable development" was created using the ConceptDraw PRO diagramming and vector drawing software extended with the Venn Diagrams solution from the area "What is a Diagram" of ConceptDraw Solution Park.
Venn diagram
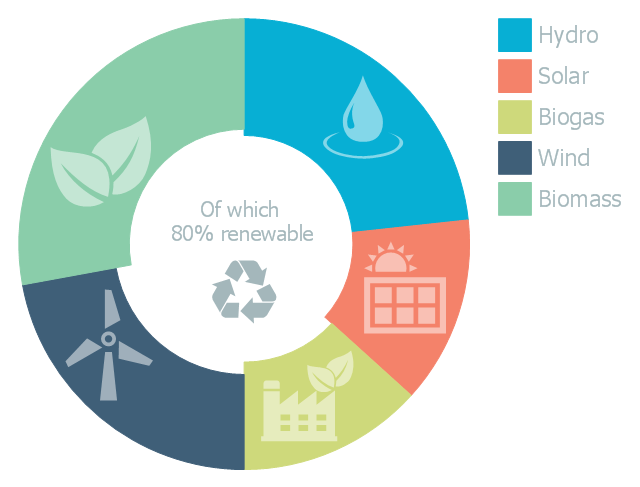
This doughnut chart sample illustrates the renewable energy sources. It was designed on the base of the Wikipedia file: Example of a doughnut chart.png.
[en.wikipedia.org/ wiki/ File:Example_ of_ a_ doughnut_ chart.png]
This file is licensed under the Creative Commons Attribution-ShareAlike 3.0 License. [creativecommons.org/ licenses/ by-sa/ 3.0/ ]
"Renewable energy is generally defined as energy that is collected from resources which are naturally replenished on a human timescale, such as sunlight, wind, rain, tides, waves, and geothermal heat. Renewable energy often provides energy in four important areas: electricity generation, air and water heating/ cooling, transportation, and rural (off-grid) energy services." [Renewable energy. Wikipedia]
The donut chart example "Renewable energy" was created using the ConceptDraw PRO diagramming and vector drawing software extended with the Pie Charts solutiton of the Graphs and Charts area in ConceptDraw Solution Park.
Donut chart
Gane Sarson Diagram

 People
This solution extends ConceptDraw DIAGRAM software with samples, templates and libraries of vector clipart for drawing the People illustrations. Use it to make professional-looking documents, presentations and websites illustrated with color scalable vector c
Pyramid Diagram

Pyramid Diagram

- HR management process - Flowchart | Components of competency ...
- Human Resource Planning Process Wikipedia
- HR management process - Flowchart | Human Resources ...
- Process Of Human Resources Planning Wikipedia With Diagram
- Components of competency based management | Green Hrm Wiki
- Hr Plan Wikipli
- Electronic human resources (E- HR ) | Block Diagram For Process Of ...
- Electronic human resources (E- HR ) | Components of competency ...
- Design elements - HR department | Electronic human resources (E ...