HelpDesk
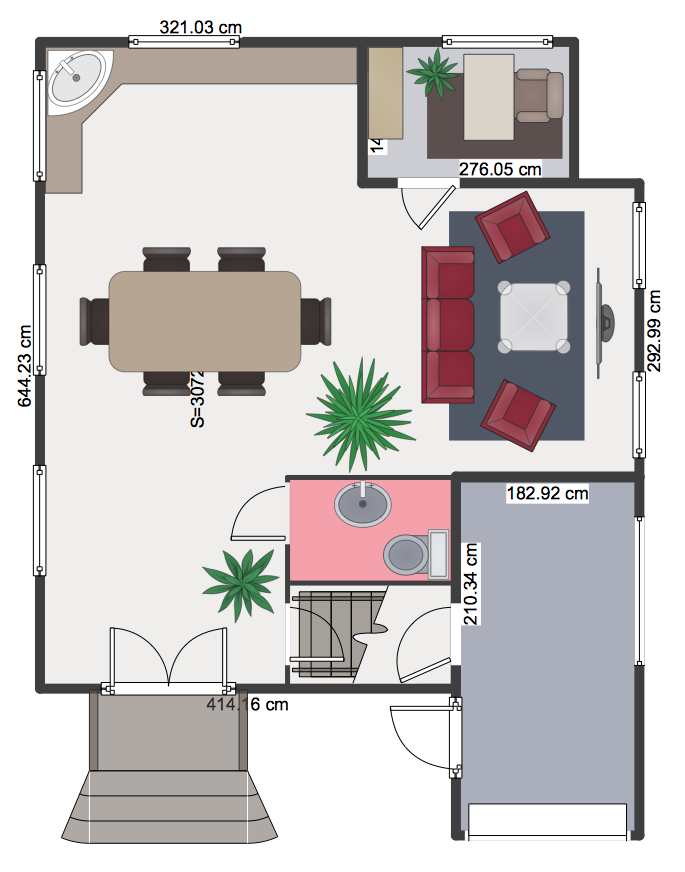
How to Create a Floor Plan
HelpDesk
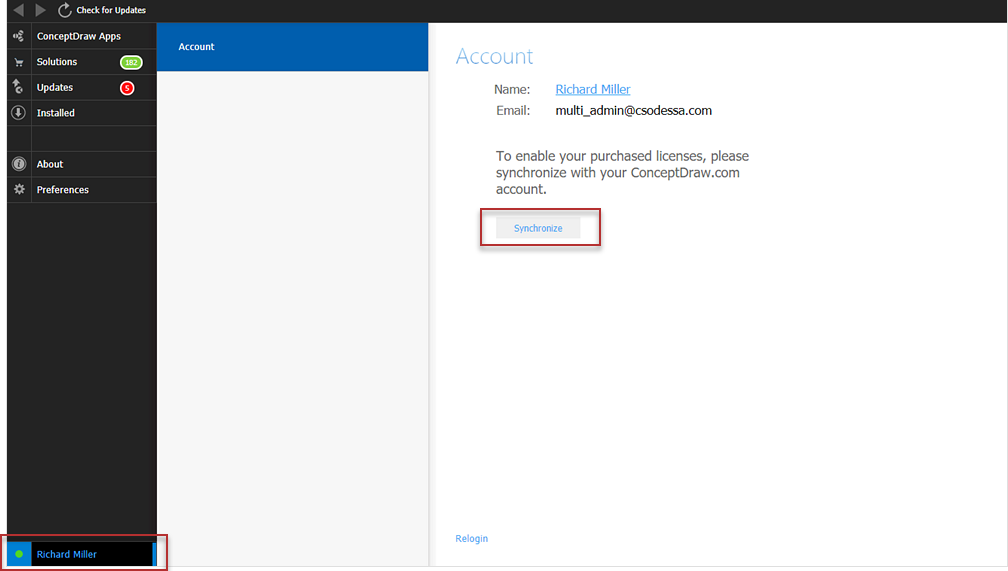
How to Use ConceptDraw Single User License

ConceptDraw DIAGRAM Compatibility with MS Visio

HelpDesk
ConceptDraw Software Full Versions Free Download
HelpDesk
How to Use ConceptDraw PROJECT Micro Reports

HelpDesk
How to Draw a Pie Chart

HelpDesk
How to Create an IDEF0 Diagram for an Application Development

HelpDesk
How to Use ConceptDraw Sales Dashboard Solution

HelpDesk
How to Create an Entity-Relationship Diagram Using ERD Solution

HelpDesk
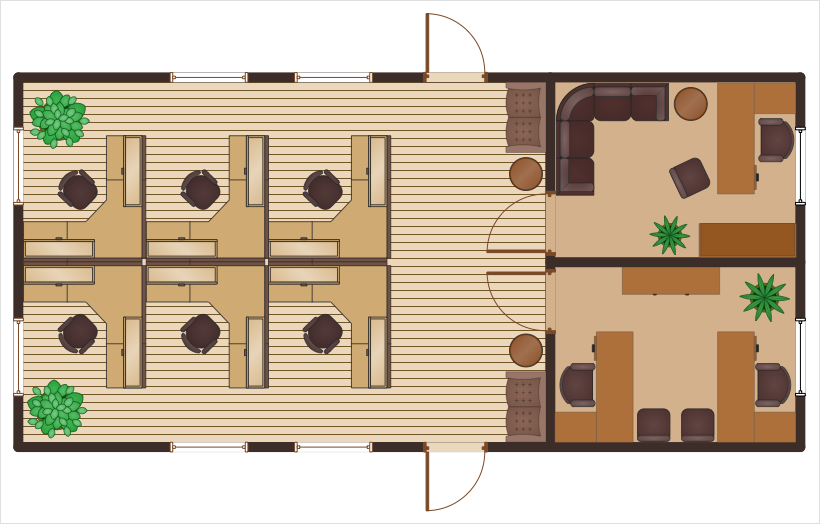
How to Draw a Floor Plan for Your Office
Use Case Diagrams technology with ConceptDraw DIAGRAM

ConceptDraw Arrows10 Technology
 Entity-Relationship Diagram (ERD)
Entity-Relationship Diagram (ERD) solution extends ConceptDraw DIAGRAM software with templates, samples and libraries of vector stencils from drawing the ER-diagrams by Chen's and crow’s foot notations.
HelpDesk
How to Create a Timeline Diagram

- Landscape Architecture with ConceptDraw PRO | How To use ...
- Conceptdraw .com: Mind Map Software, Drawing Tools | Project ...
- How to Apply Layers For a ConceptDraw Drawing on Macintosh ...
- Wiring Diagrams with ConceptDraw PRO | How To use House ...
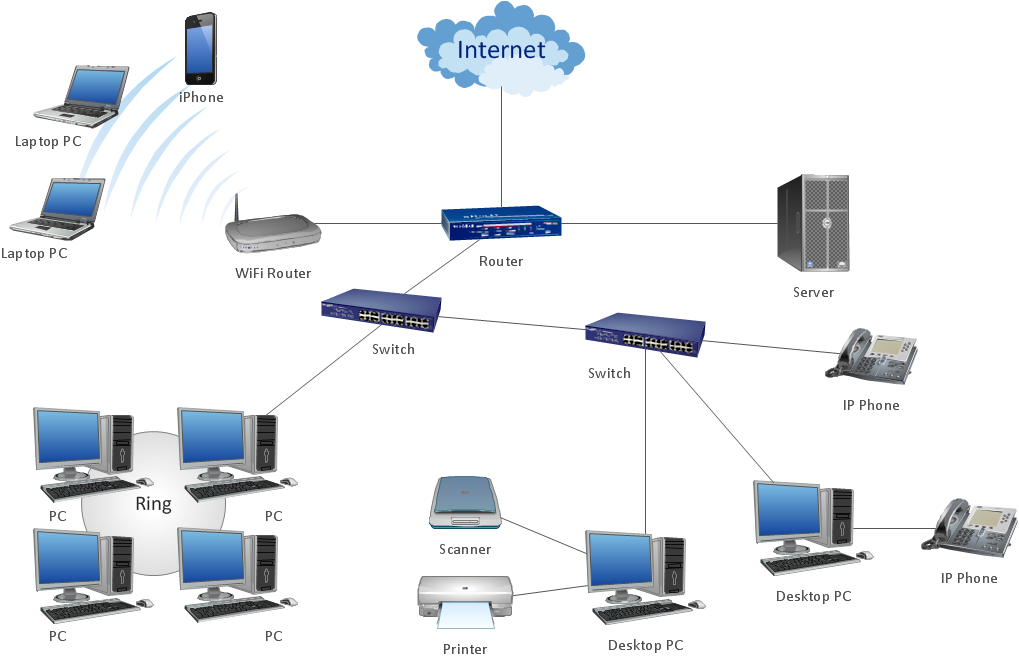
- ConceptDraw PRO Network Diagram Tool | Electrical Drawing ...
- How to Design a Garden Using ConceptDraw PRO | Modern Garden ...
- Wiring Diagrams with ConceptDraw PRO | How To use Electrical ...
- Electrical Drawing Software | How To use House Electrical Plan ...
- Use Case Diagrams technology with ConceptDraw PRO | UML Use ...
- How to Create an Electrical Diagram Using ConceptDraw PRO ...
- Use Case Diagrams technology with ConceptDraw PRO | UML ...
- Entity-Relationship Diagram (ERD) with ConceptDraw PRO ...
- Bubble diagrams in Landscape Design with ConceptDraw PRO ...
- Create Floor Plans Easily With ConceptDraw PRO | How To Create ...
- UML Diagrams with ConceptDraw PRO | Use Case Diagrams ...
- Use Case Diagrams technology with ConceptDraw PRO | Financial ...
- ConceptDraw PRO Database Modeling Software | Database ...
- How to Create a Floor Plan Using ConceptDraw PRO | How To use ...
- Landscape Architecture with ConceptDraw PRO
- How To Use Floor Plan Software | Room planning with ...