HelpDesk
How to Create a Data Flow Diagram using ConceptDraw PRO
Data flow diagramming is a highly effective technique for showing the flow of information through a system. Data flow diagrams reveal relationships among and between the various components in a program or system. DFD is an important technique for modeling a system’s high-level detail by showing how input data is transformed to output results through a sequence of functional transformations. The set of standard symbols is used to depict how these components interact in a system. ConceptDraw PRO allows you to draw a simple and clear Data Flow Diagram using special libraries.HelpDesk
How to Connect Text Data to a Time Series Chart on Your Live Dashboard
Time Series Dashboard means an integration of some type of diagrams: Line Charts, Bar Charts, Column Charts, and Dot Plots on a single space. The ConceptDraw Time Series Dashboard solution can be used to create the interactive Time Series dashboard. The libraries of Time Series Charts solution contain the Live Objects, that can change their appearance depending on the external data. Each chart from the Time Series dashboard displays particular source data. You can include Time Series Charts in your business or technical dashboards to show and compare the items changing over time.
HelpDesk
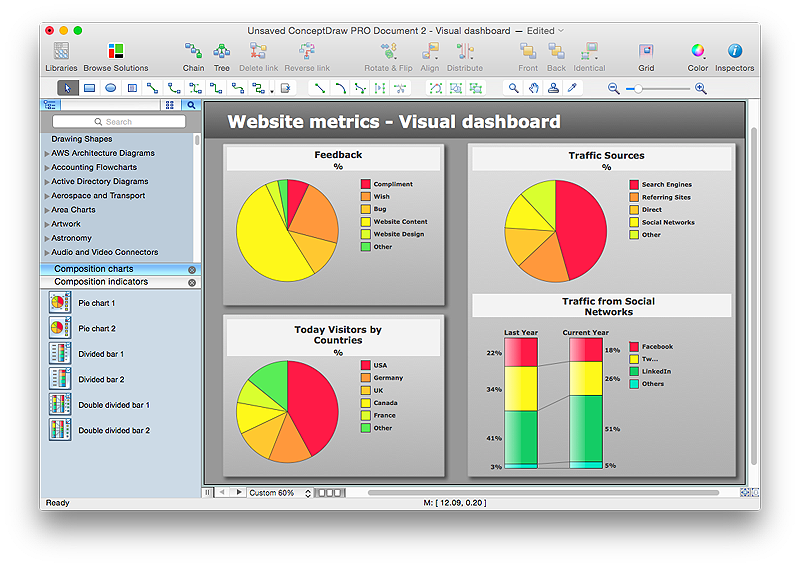
How to Draw a Pie Chart Using ConceptDraw PRO
A pie chart represents data, in a clear and easy to read round (pie) form. A circular pie chart is divided into sections (slice). Each "slice" depicts the It reflects the proportion of each component in the whole "pie". This type of chart is most often used for the visualization of statistical data. That is why pie charts are widely used in marketing. As pie charts show proportional proportional parts of a whole, they are good for various visual comparisons. For example, it is difficult to imagine a more intuitive way to show segmentation and market share. ConceptDraw PRO allows you to draw a simple and clear Pie Chart using the Pie Charts solution.ConceptDraw Arrows10 Technology
When you are connecting existing objects you can control the diagram structure by changing selection order. This is how diagramming software should work. You are able to draw a diagram as quickly as the ideas come to you.HelpDesk
How to Connect a Live Object to a Text Data Source
Instruction on how to connect a ConceptDraw live object with data source files in TXT format to visualize the actual values of your performance metrics.
HelpDesk
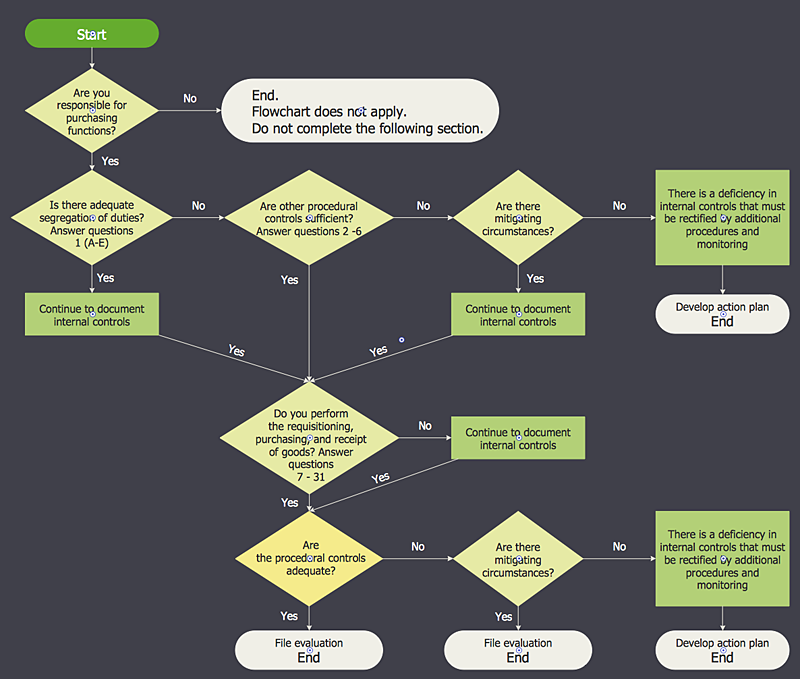
How to Create an Accounting Flowchart Using ConceptDraw Solution Park
An Accounting flowchart is a specialized type of flowchart. With the help of an accounting flowchart you can visually describe tasks, documents, people responsible for execution at each stage of accounting workflow. Find out how you can easily create an accounting flowchart of any complexity using Accounting Flowchart Solution from the ConceptDraw Solution Park.- Which Button Should You Select To Draw On Your Charts
- Recruitment And Selection Process Flowchart
- Diagram Flow Chart | Selection sorting method - Algorithm flowchart ...
- Basic Flowchart Symbols and Meaning | Audit Flowchart Symbols ...
- Flow Chart Design - How to Design a Good Flowchart | Diagram ...
- HR management process - Flowchart | Types of Flowchart ...
- Hiring Process | How to Create a HR Process Flowchart Using ...
- Basic Flowchart Symbols and Meaning | Types of Flowcharts ...
- Top 5 Android Flow Chart Apps | Selecting & Creating Flowcharts ...
- How to Create a HR Process Flowchart Using ConceptDraw PRO ...
- Basic Flowchart Symbols and Meaning | Process Flowchart ...
- Flow Chart for Olympic Sports | Diagram Flow Chart | Selecting ...
- Hiring Process | Basic Flowchart Symbols and Meaning ...
- Program Structure Diagram | Process Flowchart | Pyramid Diagram ...
- Selection In A Flowchart
- Diagram Flow Chart | Flow Chart for Olympic Sports | Creating a ...
- Flowchart Marketing Process. Flowchart Examples | Flowchart ...
- Diagram Flow Chart | Flow Chart for Olympic Sports | Selection ...
- Euclidean algorithm - Flowchart | Solving quadratic equation ...


