What is Interactive Flowcharts

Flowchart Examples

 Social Media Response
This solution extends ConceptDraw DIAGRAM and ConceptDraw MINDMAP with the ability to draw interactive flow charts with action mind map templates, to help create an effective response to applicable social media mentions.
"A website, also written as Web site, web site, or simply site, is a set of related web pages served from a single web domain. A website is hosted on at least one web server, accessible via a network such as the Internet or a private local area network through an Internet address known as a Uniform resource locator. All publicly accessible websites collectively constitute the World Wide Web.
A webpage is a document, typically written in plain text interspersed with formatting instructions of Hypertext Markup Language (HTML, XHTML). A webpage may incorporate elements from other websites with suitable markup anchors.
Webpages are accessed and transported with the Hypertext Transfer Protocol (HTTP), which may optionally employ encryption (HTTP Secure, HTTPS) to provide security and privacy for the user of the webpage content. The user's application, often a web browser, renders the page content according to its HTML markup instructions onto a display terminal.
The pages of a website can usually be accessed from a simple Uniform Resource Locator (URL) called the web address. The URLs of the pages organize them into a hierarchy, although hyperlinking between them conveys the reader's perceived site structure and guides the reader's navigation of the site which generally includes a home page with most of the links to the site's web content, and a supplementary about, contact and link page." [Website. Wikipedia]
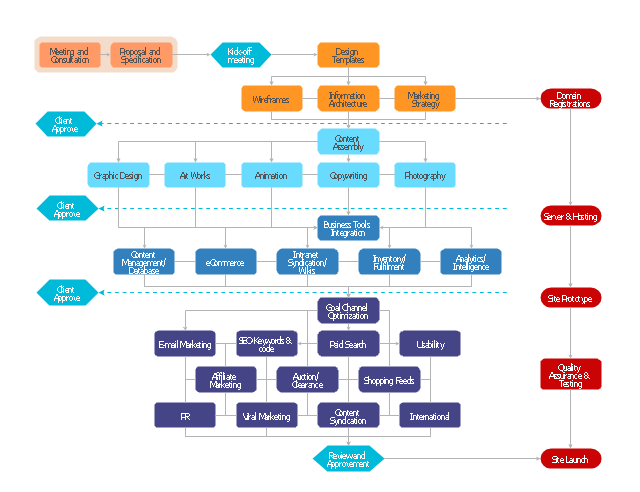
The flow chart example "Website launch" was created using the ConceptDraw PRO diagramming and vector drawing software extended with the Flowcharts solution from the area "What is a Diagram" of ConceptDraw Solution Park.
A webpage is a document, typically written in plain text interspersed with formatting instructions of Hypertext Markup Language (HTML, XHTML). A webpage may incorporate elements from other websites with suitable markup anchors.
Webpages are accessed and transported with the Hypertext Transfer Protocol (HTTP), which may optionally employ encryption (HTTP Secure, HTTPS) to provide security and privacy for the user of the webpage content. The user's application, often a web browser, renders the page content according to its HTML markup instructions onto a display terminal.
The pages of a website can usually be accessed from a simple Uniform Resource Locator (URL) called the web address. The URLs of the pages organize them into a hierarchy, although hyperlinking between them conveys the reader's perceived site structure and guides the reader's navigation of the site which generally includes a home page with most of the links to the site's web content, and a supplementary about, contact and link page." [Website. Wikipedia]
The flow chart example "Website launch" was created using the ConceptDraw PRO diagramming and vector drawing software extended with the Flowcharts solution from the area "What is a Diagram" of ConceptDraw Solution Park.
Flowchart - Website launch
 Website Wireframe
The innovative Website Wireframe solution enhances the ConceptDraw DIAGRAM functionality with newest wireframe tools, libraries with variety of predesigned icons, symbols, buttons, graphics, forms, boxes, and many other vector elements, templates and professionally designed samples, which make it the best wireframing software. Website Wireframe solution gives you significant advantages when designing and maintaining websites, creating skeletal and content-free depictions of website structure, making website prototypes and planning the content arrangement before committing to design, also speeds up the processes of sketching, producing and sharing wireframe examples of website style and interface design.
 Business Intelligence Dashboard
Business Intelligence Dashboard solution extends the ConceptDraw DIAGRAM functionality with exclusive tools, numerous ready-to-use vector objects, samples and quick-start templates for creation professional Business Intelligence Dashboards, Business Intelligence Graphics, Business Intelligence Charts and Maps of different kinds. Design easy the BI dashboard, BI model or Dynamic chart in ConceptDraw DIAGRAM to monitor the company's work, to track the indicators corresponding your company's data, to display and analyze key performance indicators, to evaluate the trends and regularities of the processes occurring at the company.
 PM Presentations
The PM Presentations solution extends the power of ConceptDraw MINDMAP , ConceptDraw DIAGRAM , and ConceptDraw PROJECT, improving their efficiency at many stages of the project management process by using the same source data to construct the targeted presentation for your audience and clearly communicating the appropriate information to different audiences from a single source. It gives an ability to project managers and other team participants to create and to deliver capacious presentations representing the data and knowledge of a specific project with the help of including visual dashboards, Gantt charts, resource views, maps, timelines, calendars, illustrations, project diagrams and reports of varied types. Having the possibility to edit collaboratively in a Full-Screen Mode, the teams can rapidly plan a project as well as execute the tasks of revising and making changes to it.
 Education Package
Education Package is a comprehensive set of multifarious graphical solutions from ConceptDraw Solution Park, collected together in help to ConceptDraw DIAGRAM users working in a field of science, education and training, which is aimed at improving the quality of education and helping to design with ease variety of interesting and colorful educational materials, diagrams, charts and maps. Use it to present the information and knowledge in an interesting, clear, structured and simple form to achieve a success in education and pedagogy, to maintain the interest of students and pupils throughout the whole learning process, at the lectures, lessons and even during independent work with additional materials, to contribute to better perception of scientific information by listeners during the conferences and reports.
- Contact List Popup
- GPS operation diagram | UML Class Diagram Notation | Basic ...
- Property Management Examples | Work Order Process Flowchart ...
- Cisco Icon | Network Icons | Flowchart design. Flowchart symbols ...
- Window elements - Vector stencils library | Process Flowchart ...
- Work Order Process Flowchart . Business Process Mapping ...
- Glyph icons - Vector stencils library | Basic Flowchart Symbols and ...
- Website Wireframe | Wireframing | Wire Frame | Wireframe Navigation
- Basic Flowchart Symbols and Meaning | Flowchart design ...
- Web Site Flow Chart