Cross-Functional Flowchart


Flow chart Example. Warehouse Flowchart


Copying Service Process Flowchart. Flowchart Examples

Types of Flowchart - Overview


This hotel computer reservations system cycle process chart example was redesigned from the Wikimedia Commons file: По-запросу.jpg.
[commons.wikimedia.org/ wiki/ File:По-запросу.jpg]
"A computer reservations system or central reservation system (CRS) is a computerized system used to store and retrieve information and conduct transactions related to air travel, hotels, car rental, or activities. ...
Modern GDSes typically allow users to book hotel rooms, rental cars, airline tickets as well as activities and tours." [en.wikipedia.org/ wiki/ Computer_ reservations_ system]
The cycle process diagram example "Hotel reservation system" was created using the ConceptDraw PRO diagramming and vector drawing software extended with the Sales Flowcharts solution from the Marketing area of ConceptDraw Solution Park.
Hotel computer reservation system - Cycle process diagram

Technical Flow Chart Example

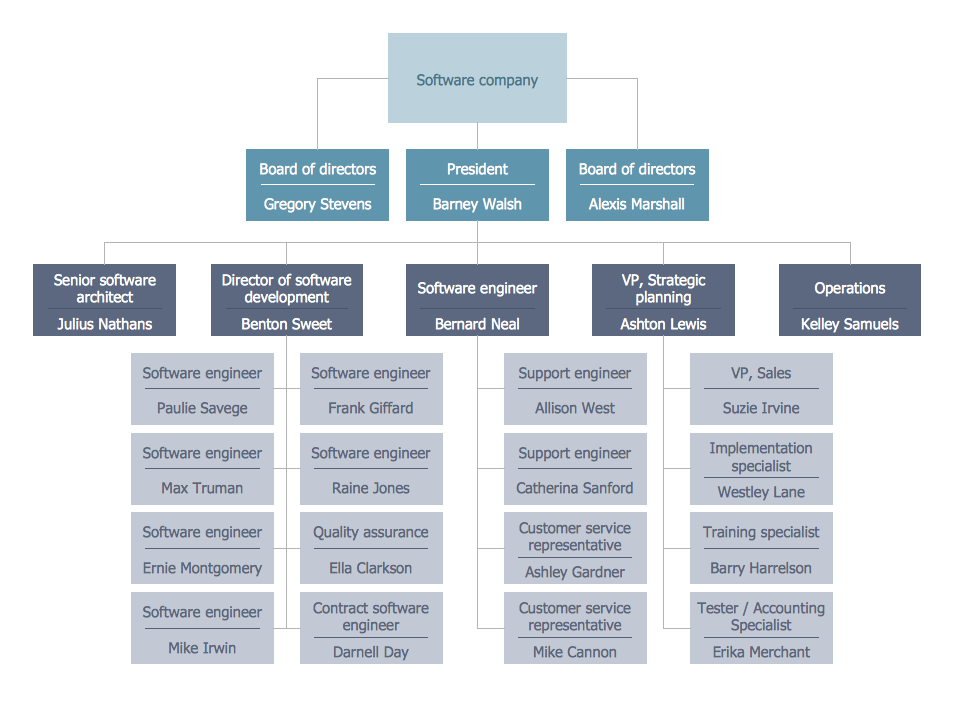
Business Structure
Structured Systems Analysis and Design Method (SSADM) with ConceptDraw DIAGRAM

DFD Library — Design elements

Sales Process

- Hotel reservation system | Manual Booking System
- Sales Flowcharts | Hotel reservation system | Cross-functional ...
- Hotel reservation system | Sales Flowcharts | Manual Hotel ...
- Hotel reservation system | Top 5 Android Flow Chart Apps | Process ...
- Sales Flowcharts | Procedure Of Hotel Booking System
- Sales Flowcharts | Data Flow Diagram Of Hotel Reservation System ...
- Hotel reservation system | ConceptDraw PRO Compatibility with MS ...
- Hotel reservation system | Sales Flowcharts | Manual Reservation ...
- Explain The Flow Chart Of Reservation Process In Hotel
- Sales Flowcharts | Data Flow Diagrams (DFD) | Hotel Reservation ...