HelpDesk
How to Create an Enterprise Architecture Diagram

How to Draw EPC Diagram Quickly


 Enterprise Architecture Diagrams
Enterprise Architecture Diagrams solution extends ConceptDraw DIAGRAM software with templates, samples and library of vector stencils for drawing the diagrams of enterprise architecture models.
 Venn Diagrams
Venn Diagrams are actively used to illustrate simple set relationships in set theory and probability theory, logic and statistics, mathematics and computer science, linguistics, sociology, and marketing. Venn Diagrams are also often used to visually summarize the status and future viability of a project.
 Fault Tree Analysis Diagrams
This solution extends ConceptDraw DIAGRAM.5 or later with templates, fault tree analysis example, samples and a library of vector design elements for drawing FTA diagrams (or negative analytical trees), cause and effect diagrams and fault tree diagrams.
Active Directory Diagram

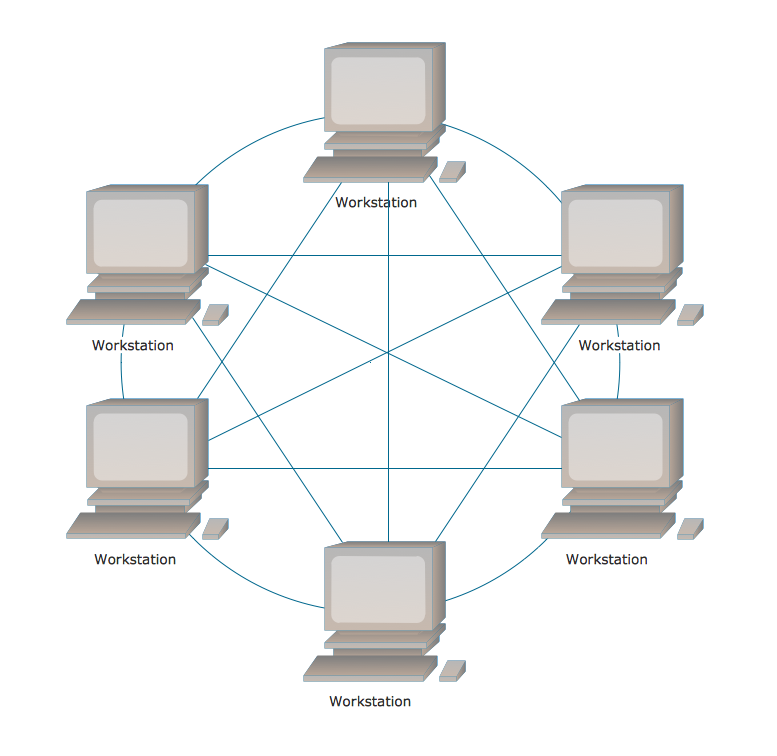
Fully Connected Network Topology Diagram
How To Create Onion Diagram

Stakeholder Onion Diagram Template

 Stakeholder Onion Diagrams
The Stakeholder Onion Diagram is often used as a way to view the relationships of stakeholders to a project goal. A basic Onion Diagram contains a rich information. It shows significance of stakeholders that will have has influence to the success achieve
- Enterprise Architecture Diagrams | How to Create an Enterprise ...
- Er Diagram Using Ea
- How to Create an Enterprise Architecture Diagram in ConceptDraw ...
- How To Draw Block Diagram In Microsoft Powerpoint
- Enterprise Architecture Diagrams | How to Draw a Fishbone ...
- ConceptDraw Solution Park | IDEF3 Standard | How to Create an ...
- How to Add a Bubble Diagram to a PowerPoint Presentation Using ...
- Enterprise Architecture Diagrams | How to Create an Enterprise ...
- Enterprise Architecture Diagrams | Business Architecture | NIH IT ...
- Network Diagram Software Enterprise Private Network | Enterprise ...