Chart Maker for Presentations

Chart Templates

The vector stencils library "Composition indicators" contains 6 dashboard graphic indicators: 2 horizontal divided bars, 2 vertical divided bars, and 2 mini pie charts.
Composition Indicators are Live Objects which show the percentage of two parts of one total.
Composition Indicators useful for:
• comparison of one part with the total
• comparison of two parts of one total.
Use this library for drawing visual dashboards in the ConceptDraw PRO diagramming and vector drawing software extended with the Composition Dashboard solution from the area "What is a Dashboard" of ConceptDraw Solution Park.
www.conceptdraw.com/ solution-park/ composition-dashboard
Horizontal Divided Bar Indicator 1

Mini Pie Chart Indicator 1

Vertical Divided Bar Indicator 1

Horizontal Divided Bar Indicator 2

Vertical Divided Bar Indicator 2

Mini Pie Chart Indicator 2

Bar Chart Software

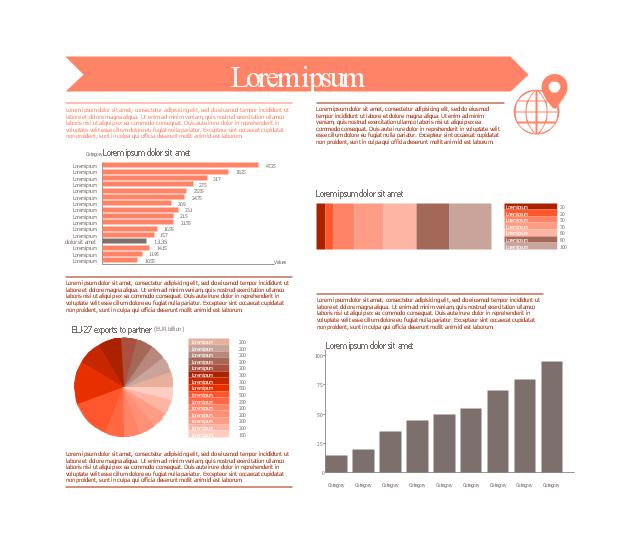
This marketing infographic template consists of design elements: title block, callout blocks, pictogram, horizontal bar graph, column chart, divided bar diagram, pie chart.
Use it to create your marketing infograms in the ConceptDraw PRO diagramming and vector drawing software.
The template "Marketing infogram 3" is included in the Marketing Infographics solution from the Business Infographics area of ConceptDraw Solution Park.
Use it to create your marketing infograms in the ConceptDraw PRO diagramming and vector drawing software.
The template "Marketing infogram 3" is included in the Marketing Infographics solution from the Business Infographics area of ConceptDraw Solution Park.
Marketing infogram template
Rainfall Bar Chart

The vector stencils library "Education charts" contains 12 graphs and charts: area chart, column chart, divided bar diagram, histogram, horizontal bar graph, line graph, pie chart, ring chart, scatter plot.
Use it to create your education infogram in the ConceptDraw PRO diagramming and vector drawing software.
The vector stencils library "Education charts" is included in the Education Infographics solution from the Business Infographics area of ConceptDraw Solution Park.
Use it to create your education infogram in the ConceptDraw PRO diagramming and vector drawing software.
The vector stencils library "Education charts" is included in the Education Infographics solution from the Business Infographics area of ConceptDraw Solution Park.
Area chart - serial

Column chart

Column chart - serial

Divided bar diagram

Frequency histogram

Horizontal bar chart

Horizontal bar chart - serial

Line chart - serial

Pie chart

Ring chart

Scatter plot

Scatter plot - serial

Chart Examples

The vector stencils library "Management indicators" contains 14 visual indicators.
Use it to create your management infogram in the ConceptDraw PRO diagramming and vector drawing software.
The example "Management indicators - Vector stencils library" is included in the solution "Marketing infographics" from the "Business infographics" area of ConceptDraw Solution Park.
Use it to create your management infogram in the ConceptDraw PRO diagramming and vector drawing software.
The example "Management indicators - Vector stencils library" is included in the solution "Marketing infographics" from the "Business infographics" area of ConceptDraw Solution Park.
1-Sector donut chart

1-Sector pie chart

2-Bars horizontal bar chart

2-Columns arrow chart
2-Columns arrow chart 2
2-Sectors donut chart

2-Sectors pie chart

Bullet indicator

Progress bar

Radial gauge

Semi-radial gauge

Square chart 10x10 - filling from above

Square chart 10x10 - filling from below

Stickman row pictograph

How to Create a Bar Chart

- Pie Charts | Basic Pie Charts | Horizontal Flowchart | Wireframe ...
- Organization Chart Software | Horizontal Org Flow Chart | How to ...
- Percentage Pie Chart . Pie Chart Examples | Organizational Chart ...
- Horizontal bar chart - The most spoken languages of the world | Bar ...
- Pie charts - Vector stencils library | Data-driven charts - Vector ...
- Frequency Barchart Piechart Image
- Data-driven charts - Vector stencils library | Pie Chart Software ...
- Gauge Chart
- How to Draw the Different Types of Pie Charts | Circular arrows ...
- Bar Chart Software | Bar Graphs | Bar Chart Examples | Horizontal ...