Organizational Structure

Create Organizational Chart
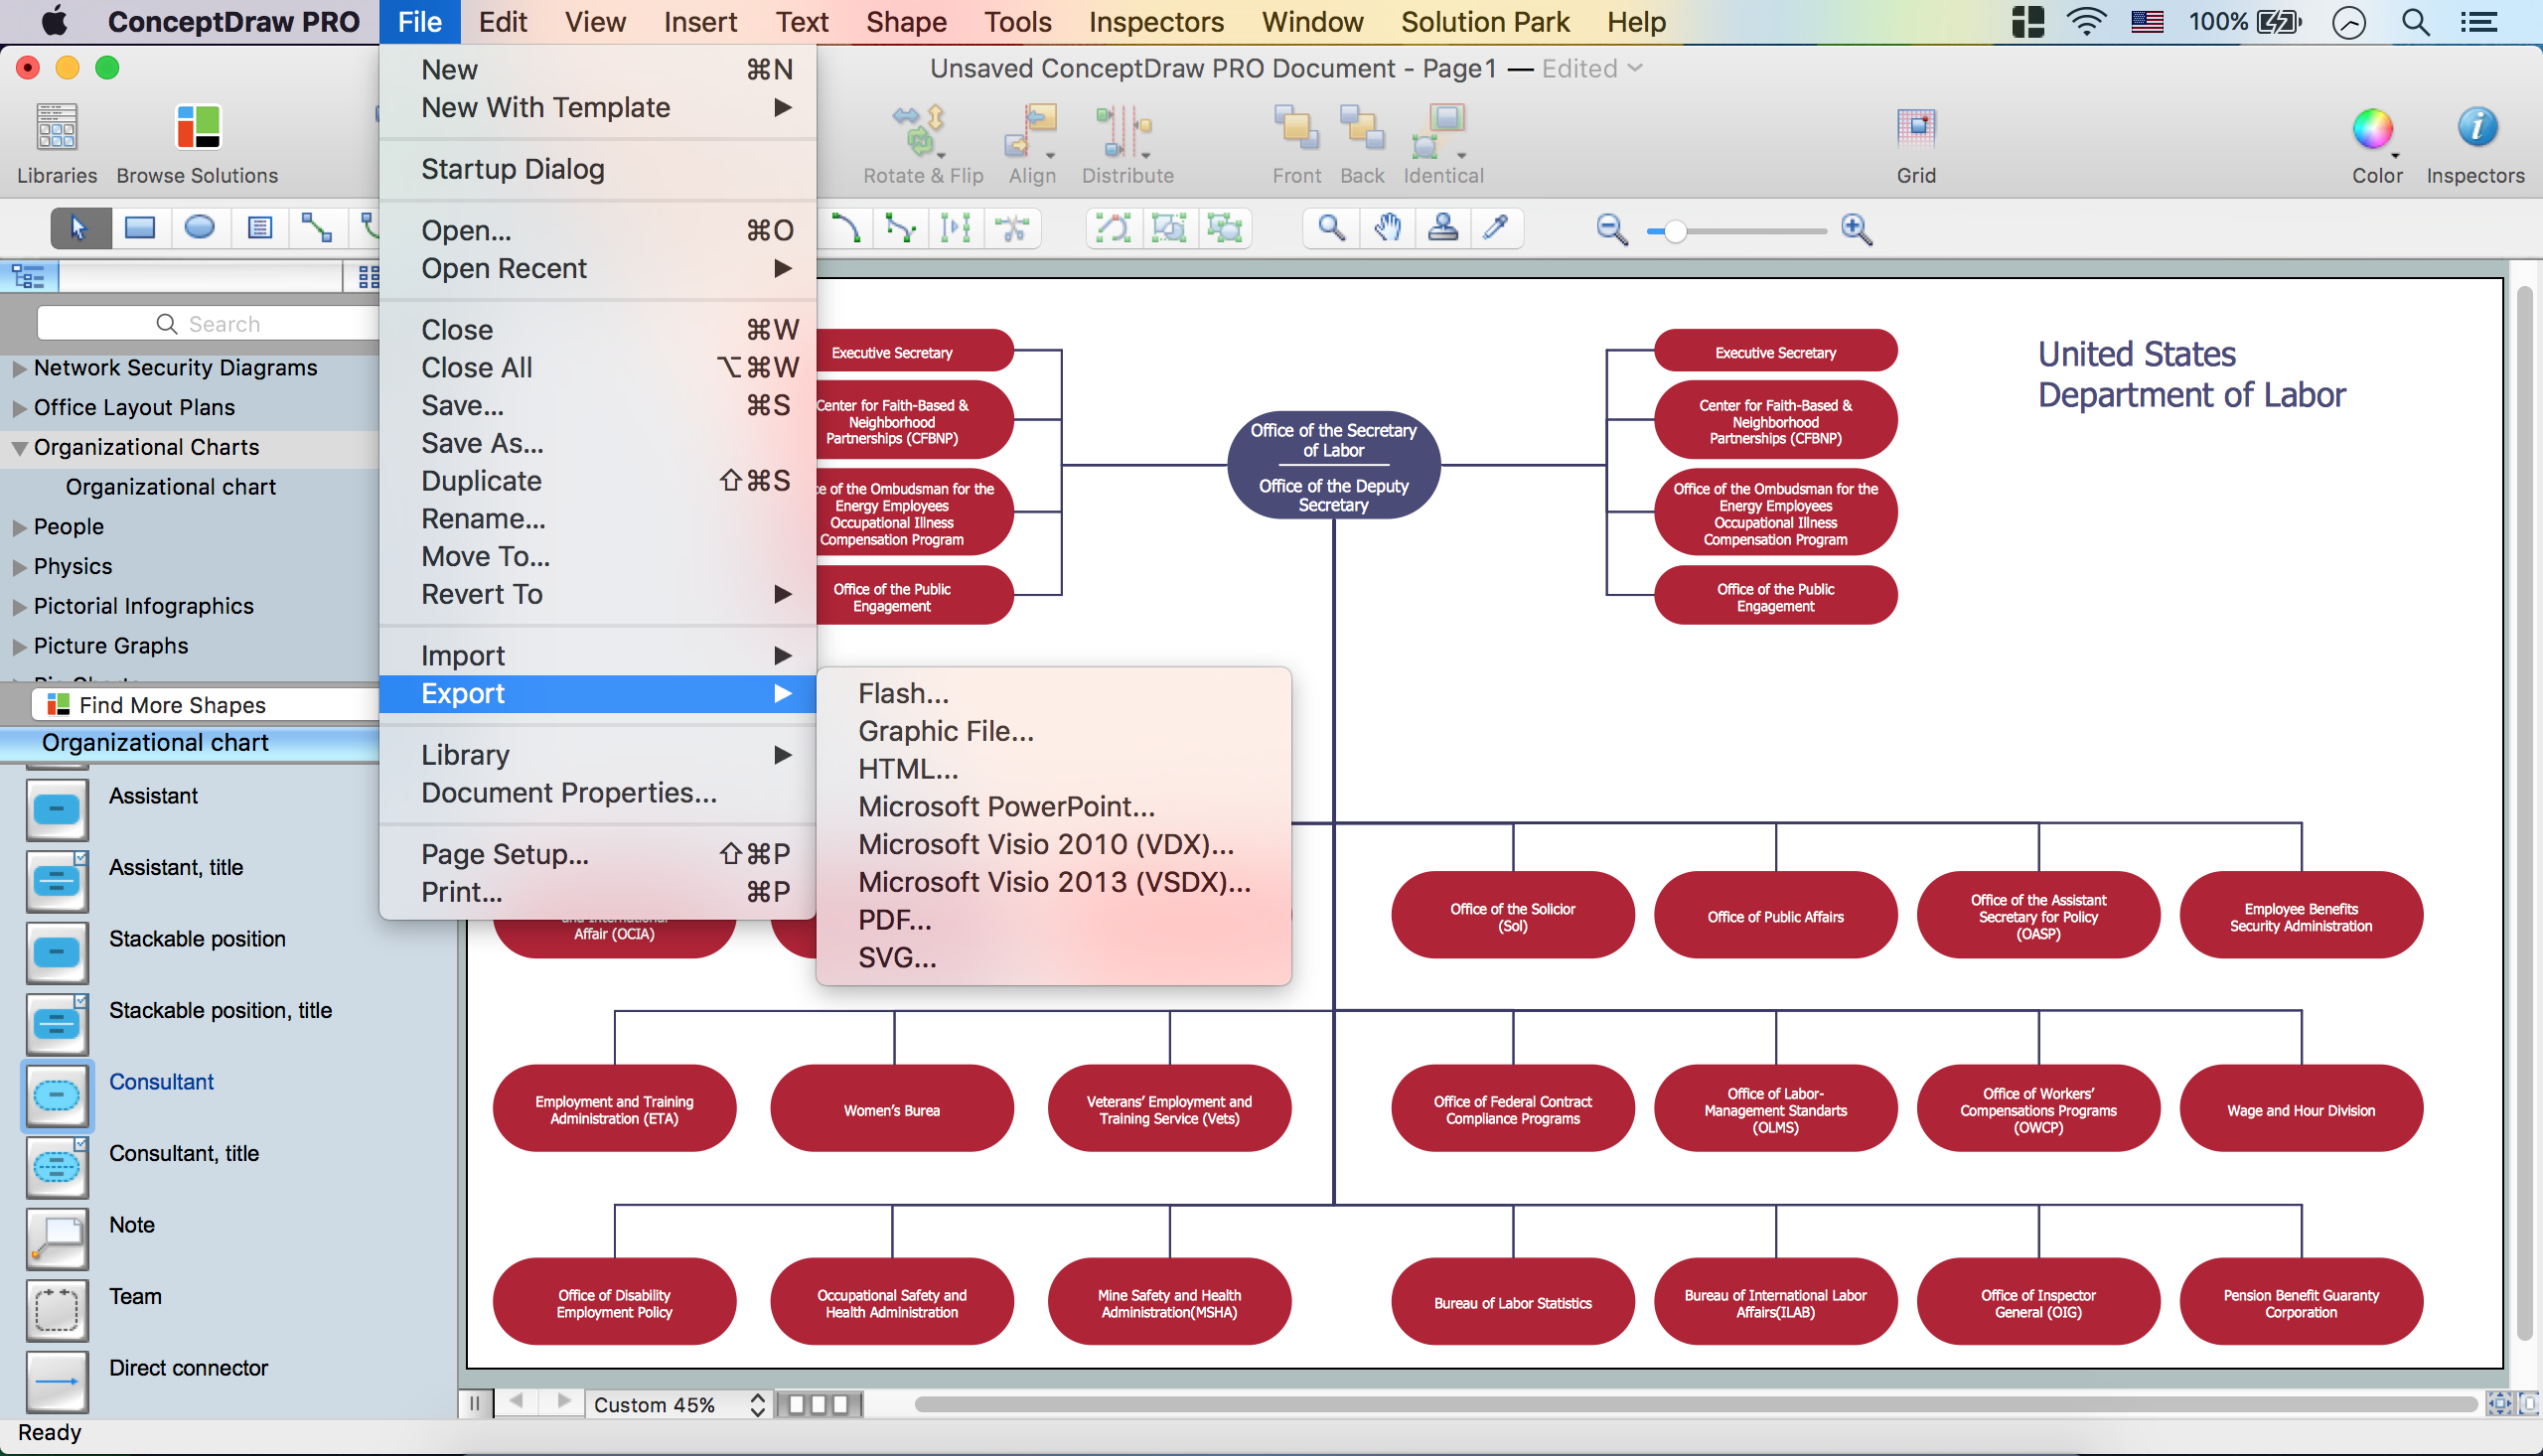
Organizational Chart

Basic Flowchart Images. Flowchart Examples

Business Productivity - Management

Flowchart Software


Affinity Diagram

 Seven Management and Planning Tools
Seven Management and Planning Tools solution extends ConceptDraw DIAGRAM and ConceptDraw MINDMAP with features, templates, samples and libraries of vector stencils for drawing management mind maps and diagrams.
Electrical Symbols, Electrical Diagram Symbols

- Management Area | Holding Company Business Plan Template
- Organizational Structure | Process Flowchart | Column Chart ...
- Company Structure Chart
- Management | Divisional Organisational Structure Diagram
- ConceptDraw Office: What Our Users Say
- Banquet Organizational Structure
- Organizational Charts | How to Create a Bank ATM Use Case ...
- How to Create Organizational Chart Quickly | How to Draw an ...
- Divisional Organizational Structure