 Basic Histograms
This solution extends the capabilities of ConceptDraw PRO v10.3.0 (or later) with templates, samples and a library of vector stencils for drawing Histograms.
Histogram
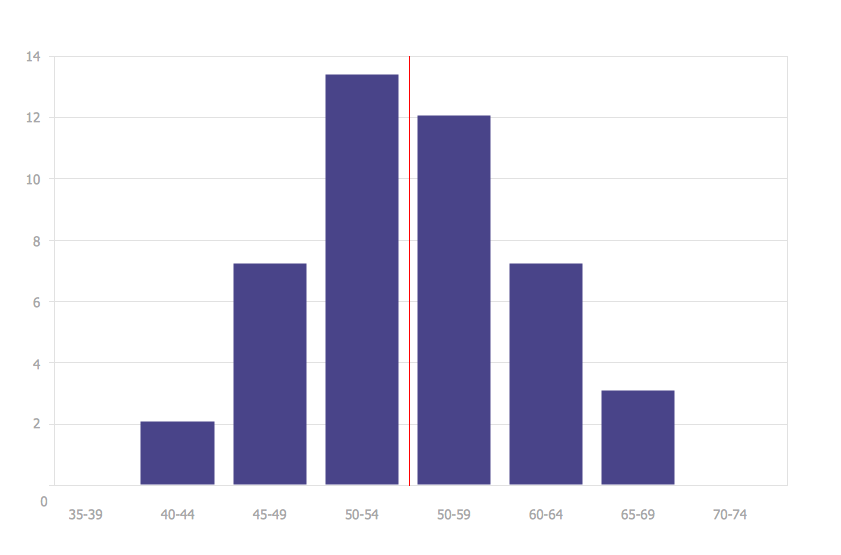
ConceptDraw PRO diagramming and vector drawing software offers the Histograms solution from the Graphs and Charts area of ConceptDraw Solution Park with powerful tools to help you draw a Histogram of any complexity quick and easy.
 Histograms
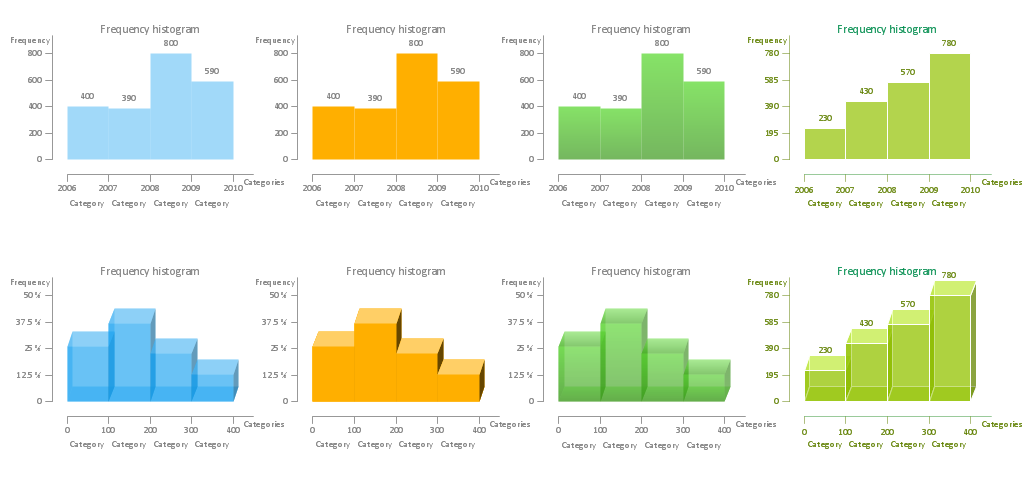
How to make a Histogram? Making a Histogram is an incredibly easy process when it is done with ConceptDraw PRO. The Histograms Solution enhances ConceptDraw PRO v10 functionality with extensive drawing tools, numerous samples, and examples; also a quick-start template and library of ready vector stencils for visualization the data and professional drawing Histograms.
Make a Histogram
ConceptDraw PRO extended with Histograms solution from the Graphs and Charts area of ConceptDraw Solution Park lets you make a Histogram of any complexity in minutes.How To Make a Histogram?
How to make a Histogram quick and easy? ConceptDraw PRO diagramming and vector drawing software extended with Histograms solution from the Graphs and Charts area will effectively help you in Histogram drawing.Making a Histogram
ConceptDraw PRO is a powerful diagramming and vector drawing software. Extended with Histograms solution from the Graphs and Charts area, ConceptDraw PRO became the ideal software for making a Histogram.How To Draw a Histogram?
How to draw a Histogram? It's very fast and easy to draw any Histogram using the tools of ConceptDraw PRO software extended with Histograms solution from the Graphs and Charts area of ConceptDraw Solution Park.
 Presentation Clipart
Presentation design elements solution extends ConceptDraw PRO software with slide samples, templates and vector stencils libraries with design elements of presentation symbols, arrows, callouts, backgrounds, borders and frames, title blocks.
 Holiday
The Holiday Solution from Illustration area of ConceptDraw Solution Park contains holiday illustration examples, templates and vector clipart library.
 Health Food
The Health Food solution contains the set of professionally designed samples and large collection of vector graphic libraries of healthy foods symbols of fruits, vegetables, herbs, nuts, beans, seafood, meat, dairy foods, drinks, which give powerful possi
 Seven Basic Tools of Quality
Manage quality control in the workplace, using fishbone diagrams, flowcharts, Pareto charts and histograms, provided by the Seven Basic Tools of Quality solution.
 Pie Charts
Pie Charts are extensively used in statistics and business for explaining data and work results, in mass media for comparison (i.e. to visualize the percentage for the parts of one total), and in many other fields. The Pie Charts solution for ConceptDraw PRO v10 offers powerful drawing tools, varied templates, samples, and a library of vector stencils for simple construction and design of Pie Charts, Donut Chart, and Pie Graph Worksheets.
Chart Maker for Presentations
Easy charting software comes with beautiful chart templates and examples. This makes it easy to create professional charts without prior experience.Bar Chart
ConceptDraw PRO extended with Bar Graphs solution from Graphs and Charts area of ConceptDraw Solution Park is ideal software for quick and simple drawing bar chart of any complexity graph.- Increasing Histogram Clipart Png
- Beetles in the river Thames | How Do You Make a Histogram ...
- Food - Vector stencils library | Histogram Chart | Make a Histogram ...
- Aerospace - Design Elements | Aerospace clipart example ...
- Wind speed histogram | Resources and energy - Vector stencils ...
- Wind Turbine Clipart Png Free
- Beetles in the river Thames | Geography - Vector stencils library ...
- Wind speed histogram | Resources and energy - Vector stencils ...
- New Year And Christmas Card Png
- Distribution Clipart Png
- Frequency Histogram Yellow Clipart
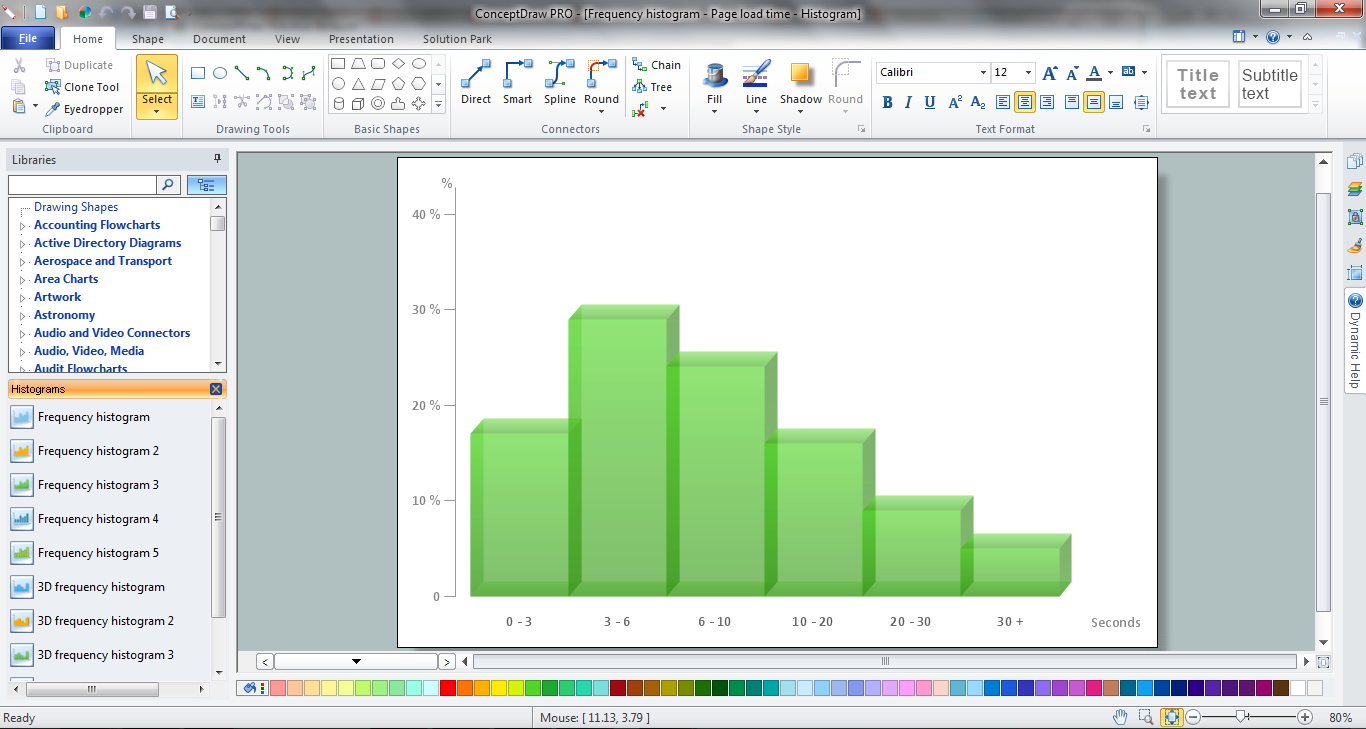
- Page load time | Make a Histogram | How to Draw a Histogram in ...
- Beauty in nature Illustrations and Clipart | Drawing Illustration | Geo ...
- River Clipart Free
- Seven Basic Tools of Quality | Wind Arrows Clipart
- Beetles in the river Thames - Frequency histogram | How Do You ...
- Horizontal Bar Graph Png
- People Clipart Png Black
- Frequency Distribution Icon Png
- Employee Clipart Free Png


