HelpDesk
How to Draw a Histogram

Chart Examples

 Histograms
How to make a Histogram? Making a Histogram is an incredibly easy process when it is done with ConceptDraw DIAGRAM. The Histograms Solution enhances ConceptDraw DIAGRAM functionality with extensive drawing tools, numerous samples, and examples; also a quick-start template and library of ready vector stencils for visualization the data and professional drawing Histograms.
The vector stencils library "Histograms" contains 8 templates of histograms for visualizing frequency distribution data.
Drag a template from the library to your document and enter your data.
Use these shapes to draw your histograms in ConceptDraw PRO diagramming and vector drawing software.
The vector stencils library "Histograms" is included in the Histograms solution from the Graphs and Charts area of ConceptDraw Solution Park.
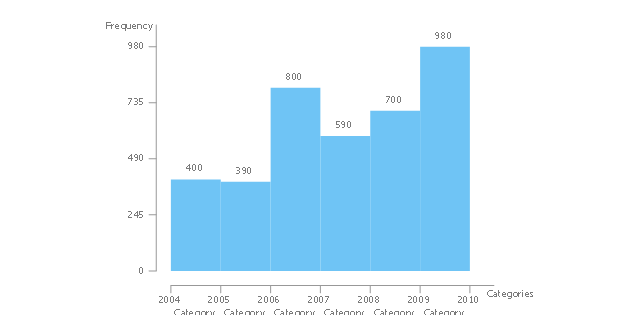
Frequency histogram
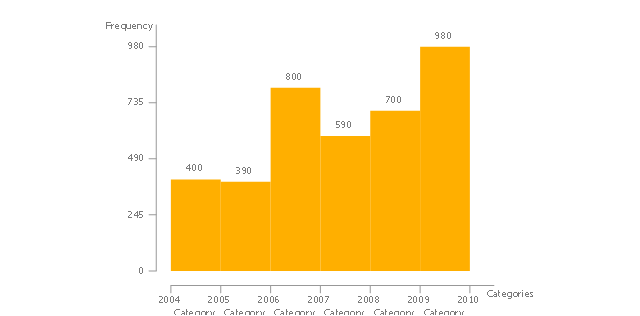
Frequency histogram 2
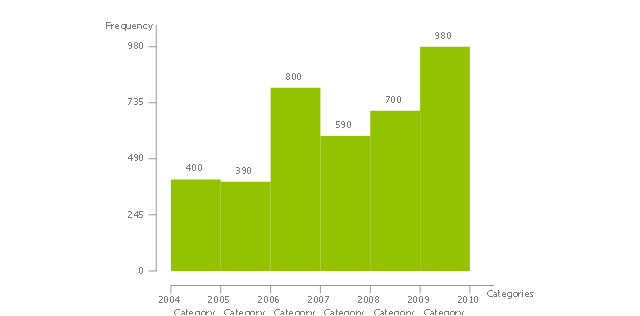
Frequency histogram 3
Frequency histogram (table)
-histograms---vector-stencils-library.png--diagram-flowchart-example.png)
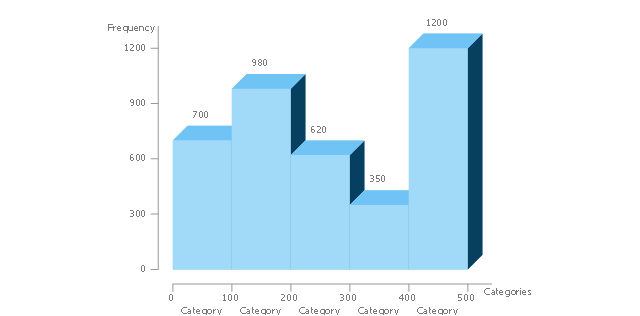
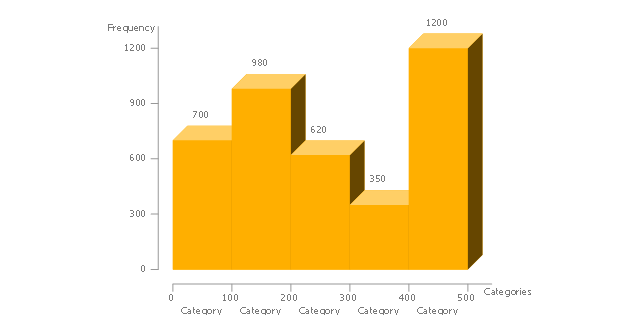
3D frequency histogram
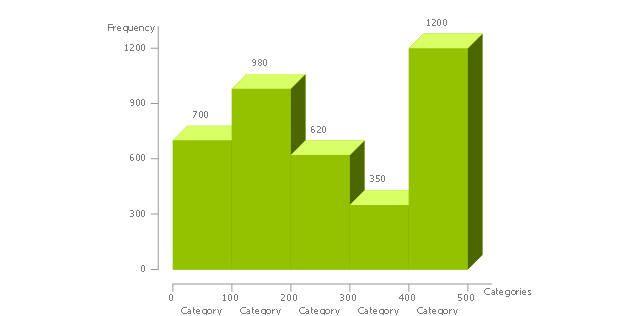
3D frequency histogram 2
3D frequency histogram 3
3D frequency histogram (table)
-histograms---vector-stencils-library.png--diagram-flowchart-example.png)
Chart Templates

 Business Diagrams Package
Business Diagrams Package is a large set of comprehensive graphical solutions from the ConceptDraw Solution Park, which are powerful in solving the business, marketing and quality tasks in completely different fields, such as finance, education, health food and cooking, HR, and many others. The tools of this package's solutions are a powerful assistant in drawing all diversity of Financial and Marketing infographics, Business process workflow diagrams, Organizational charts, Education infographics, Quality diagrams, Health food diagrams, HR flowcharts, as well as different graphics and charts, which depict the values of key business indicators, their dependencies, give the full understanding of a situation within a company and on the market.
 Basic Histograms
This solution extends the capabilities of ConceptDraw DIAGRAM (or later) with templates, samples and a library of vector stencils for drawing Histograms.
 Bar Graphs
The Bar Graphs solution enhances ConceptDraw DIAGRAM functionality with templates, numerous professional-looking samples, and a library of vector stencils for drawing different types of Bar Graphs, such as Simple Bar Graph, Double Bar Graph, Divided Bar Graph, Horizontal Bar Graph, Vertical Bar Graph, and Column Bar Chart.
Chart Maker for Presentations

Column Chart Examples

- 3d Bar Graph Horizontal Png
- Circles 3d Png
- 3D Bar graph - Number of Members in the CNT between 1911 and ...
- Histograms - Vector stencils library | How to Draw a Histogram in ...
- 3D Network Diagram Software | Directional Maps | How to Draw a ...
- Horizontal Bar Chart Examples Infographics
- Histogram Chart | Seven Basic Tools of Quality - Histogram | How to ...
- Histograms - Vector stencils library | Frequency distribution charts ...
- Histogram In 3d
- How to Create a Bar Chart | 3D Column chart - Iran internet users ...