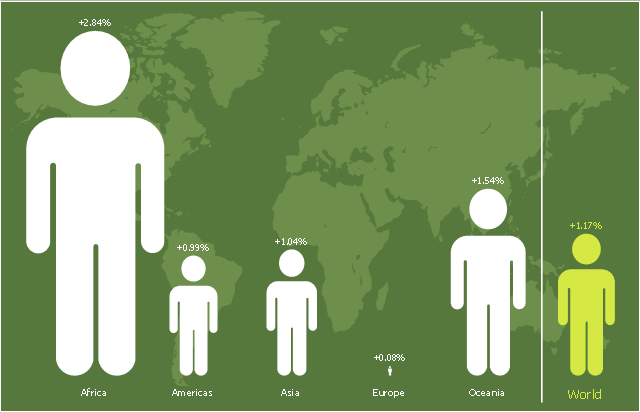
"Population growth' refers to the growth in human populations. Global population growth is around 80 million annually, or 1.2% p.a. The global population has grown from 1 billion in 1800 to 7 billion in 2012. It is expected to keep growing to reach 11 billion by the end of the century. Most of the growth occurs in the nations with the most poverty, showing the direct link between high population growth and low standards of living. The nations with high standards of living generally have low or zero rates of population growth. Australia's population growth is around 400,000 annually, or 1.8% p.a., which is nearly double the global average. It is caused mainly by very high immigration of around 200,000 p.a., the highest immigration rate in the world. Australia remains the only nation in the world with both high population growth and high standards of living." [Population growth. Wikipedia]
The pictorial chart example "Population growth by continent, 2010 - 2013" was created using the ConceptDraw PRO diagramming and vector drawing software extended with the Picture Graphs solution from the Graphs and Charts area of ConceptDraw Solution Park.
The pictorial chart example "Population growth by continent, 2010 - 2013" was created using the ConceptDraw PRO diagramming and vector drawing software extended with the Picture Graphs solution from the Graphs and Charts area of ConceptDraw Solution Park.
Image chart
Geo Map - Asia

Line Chart Examples

Pictures of Graphs

Basic Diagramming


Picture Graph

Geo Map - Europe - Belarus

What Is a Line Chart

 Picture Graphs
Typically, a Picture Graph has very broad usage. They many times used successfully in marketing, management, and manufacturing. The Picture Graphs Solution extends the capabilities of ConceptDraw PRO v10 with templates, samples, and a library of professionally developed vector stencils for designing Picture Graphs.
Basic Diagramming


Blank Scatter Plot

Area Chart

How To Draw a Diagram

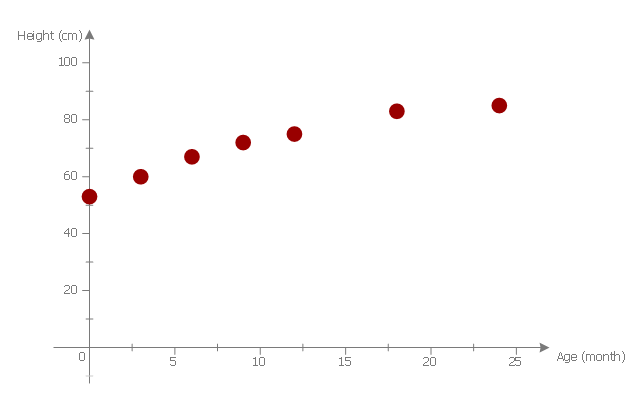
This scatter graph example visualize correlation between baby height and age.
"Human height is the distance from the bottom of the feet to the top of the head in a human body, standing erect. It is usually measured in centimetres when using the metric system, and feet and inches when using the imperial system. Human height has varied from under 60 centimetres (2 ft 0 in) to over 260 centimetres (8 ft 6 in). On average, males are taller than females. ...
Growth in stature, determined by its various factors, results from the lengthening of bones via cellular divisions chiefly regulated by somatotropin (human growth hormone (hGH)) secreted by the anterior pituitary gland. ...
The majority of linear growth occurs as growth of cartilage at the epiphysis (ends) of the long bones which gradually ossify to form hard bone. The legs compose approximately half of adult human height, and leg length is a somewhat sexually dimorphic trait. Some of this growth occurs after the growth spurt of the long bones has ceased or slowed. The majority of growth during growth spurts is of the long bones. Additionally, the variation in height between populations and across time is largely due to changes in leg length. The remainder of height consists of the cranium. Height is sexually dimorphic and statistically it is more or less normally distributed, but with heavy tails." [Human height. Wikipedia]
The scatter plot example "Baby height by age" was created using the ConceptDraw PRO diagramming and vector drawing software extended with the Scatter Diagrams solution from the Graphs and Charts area of ConceptDraw Solution Park.
Scatter diagram
 Area Charts
Area Charts are used to display the cumulative totals over time using numbers or percentages; or to show trends over time among related attributes. The Area Chart is effective when comparing two or more quantities. Each series of data is typically represented with a different color, the use of color transparency in an object’s transparency shows overlapped areas and smaller areas hidden behind larger areas.
- Picture Graphs | How to Create a Picture Graph in ConceptDraw ...
- Image chart - The total financing of the Philippines from 2001-2010 ...
- Picture Graph
- Basic Diagramming | Sales Growth . Bar Graphs Example | Pictures ...
- Videos Bar Graph Growth In Population
- Population growth by continent, 2010 - 2013 - Picture graph | Geo ...
- Barrie population - Picture bar graph | Picture Graph | Sales Growth ...
- Picture Graphs | Sales Growth . Bar Graphs Example | Barrie ...
- Picture Graph | Sales Growth . Bar Graphs Example | Line Graph ...
- Bar Graph Of Population Growth Rate
- Picture Graphs | Pictures of Graphs | Area Charts | Population ...
- Population Growth In A Pie Graph Images
- Basic Diagramming | Sales Growth . Bar Graphs Example | Area ...
- Pictures of Graphs | Population growth by continent, 2010 - 2013 ...
- Bar Graphs | Line Graphs | Sales Growth . Bar Graphs Example ...
- Bar Graph Template Population Increase
- Population growth by continent, 2010 - 2013 - Picture graph | Geo ...
- Picture Graphs | Population growth by continent, 2010 - 2013 ...
- Population Chart Drawing
- San Francisco CA population growth | Population growth by ...