"Time management is the .. process of planning and exercising conscious control over the amount of time spent on specific activities, especially to increase effectiveness, efficiency or productivity. Time management may be aided by a range of skills, tools, and techniques used to manage time when accomplishing specific tasks, projects, and goals complying with a due date. Initially, time management referred to just business or work activities, but eventually the term broadened to include personal activities as well. A time management system is a designed combination of processes, tools, techniques, and methods. Time management is usually a necessity in any project development as it determines the project completion time and scope." [Time management. Wikipedia]
This timetable pie chart shows the plan of daily actions and its durations in minutes.
It is useful visual tool of personal time management.
This schedule pie chart example was created using the ConceptDraw PRO diagramming and vector drawing software extended with the Target and Circular Diagrams solution from the Marketing area of ConceptDraw Solution Park.
www.conceptdraw.com/ solution-park/ marketing-target-and-circular-diagrams
Daily activities pie chart

 Bar Graphs
The Bar Graphs solution enhances ConceptDraw PRO v10 functionality with templates, numerous professional-looking samples, and a library of vector stencils for drawing different types of Bar Graphs, such as Simple Bar Graph, Double Bar Graph, Divided Bar Graph, Horizontal Bar Graph, Vertical Bar Graph, and Column Bar Chart.
Chart Examples

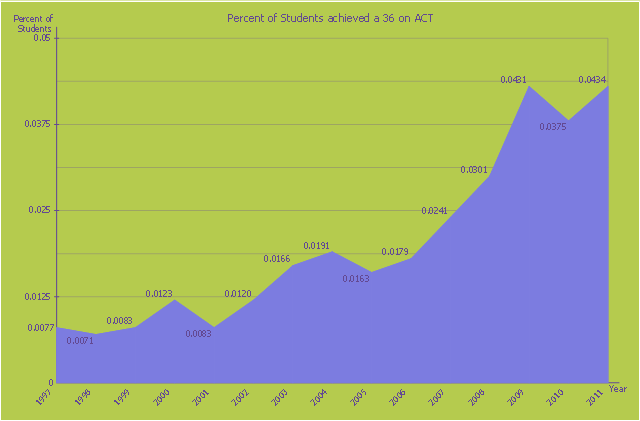
This area chart sample shows the percent of students achieved a 36 on ACT from 1997 to 2011. It was designed on the base of the Wikimedia Commons file: ACT-36-1997 to 2011.png. [commons.wikimedia.org/ wiki/ File:ACT-36-1997_ to_ 2011.png]
This file is licensed under the Creative Commons Attribution-Share Alike 3.0 Unported license. [creativecommons.org/ licenses/ by-sa/ 3.0/ deed.en]
"The ACT (originally an abbreviation of American College Testing) college readiness assessment is a standardized test for high school achievement and college admissions in the United States produced by ACT, Inc. ...
The required portion of the ACT is divided into four multiple choice subject tests: English, mathematics, reading, and science reasoning. Subject test scores range from 1 to 36; all scores are integers. The English, mathematics, and reading tests also have subscores ranging from 1 to 18. (The subject score is not the sum of the subscores.) The composite score is the average of all four tests. In addition, students taking the optional writing test receive a writing score ranging from 1 to 36 (This is a change from the previous 2–12 score range). The writing score does not affect the composite score." [ACT (test). Wikipedia]
The area graph example "Persent of Students achieved a 36 on ACT" was created using the ConceptDraw PRO diagramming and vector drawing software extended with the Area Charts solution from the Graphs and Charts area of ConceptDraw Solution Park.
Area chart
Basic Flowchart Symbols and Meaning


 Line Graphs
How to draw a Line Graph with ease? The Line Graphs solution extends the capabilities of ConceptDraw PRO v10 with professionally designed templates, samples, and a library of vector stencils for drawing perfect Line Graphs.
Line Chart Examples

Line Charts

Chart Templates

Business process Flow Chart — Event-Driven Process chain (EPC) diagrams
 diagram, Process flow diagram tool")
 Area Charts
Area Charts are used to display the cumulative totals over time using numbers or percentages; or to show trends over time among related attributes. The Area Chart is effective when comparing two or more quantities. Each series of data is typically represented with a different color, the use of color transparency in an object’s transparency shows overlapped areas and smaller areas hidden behind larger areas.
 Picture Graphs
Typically, a Picture Graph has very broad usage. They many times used successfully in marketing, management, and manufacturing. The Picture Graphs Solution extends the capabilities of ConceptDraw PRO v10 with templates, samples, and a library of professionally developed vector stencils for designing Picture Graphs.
Basic Diagramming Flowchart Software

 Cross-Functional Flowcharts
Cross-functional flowcharts are powerful and useful tool for visualizing and analyzing complex business processes which requires involvement of multiple people, teams or even departments. They let clearly represent a sequence of the process steps, the order of operations, relationships between processes and responsible functional units (such as departments or positions).
Relative Value Chart Software

- Graph Chart About A Students Daily Activity
- Graphs Chart On The Daily Activities Of A Student
- Schedule pie chart - Daily action plan | Graph For Student Daily ...
- Graphs Chart Daily Activities Of A Student
- Graphs Charts Students Daily Activites
- Graph The Time Allocation Of Students Daily Activities
- Circle Graph Sample Stident Daily Activity
- Pie Graph For Daily Lives Of Students
- Showing The Graph Chart Daily Activities
- Graphs Charts Allocation Of Students Daily Activities
- Pie Chart Of Daily Activities Of A Student
- Allocation Of Students Daily Activities
- Graph And Chat Daily Activities
- Graph For Daily Activity Management
- Graph And Chart The Time Allocation Of Students Daily Activities
- Student Daily Activities Graph And Chart
- Schedule pie chart - Daily action plan | Percentage Pie Chart . Pie ...
- Schedule pie chart - Daily action plan | How to Draw a Pie Chart ...
- Graph Chart Of Daily Activities
- A Pie Chart Showing A Students Daily Activities With Description