HelpDesk
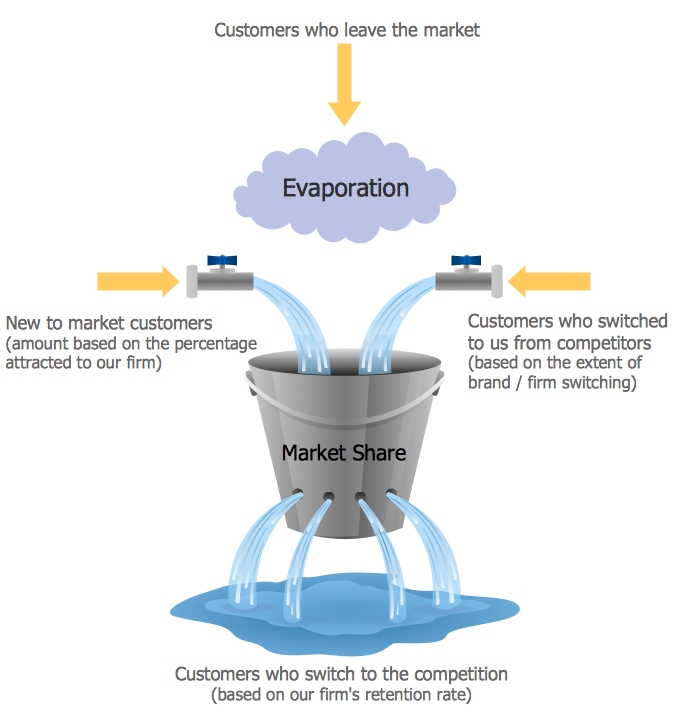
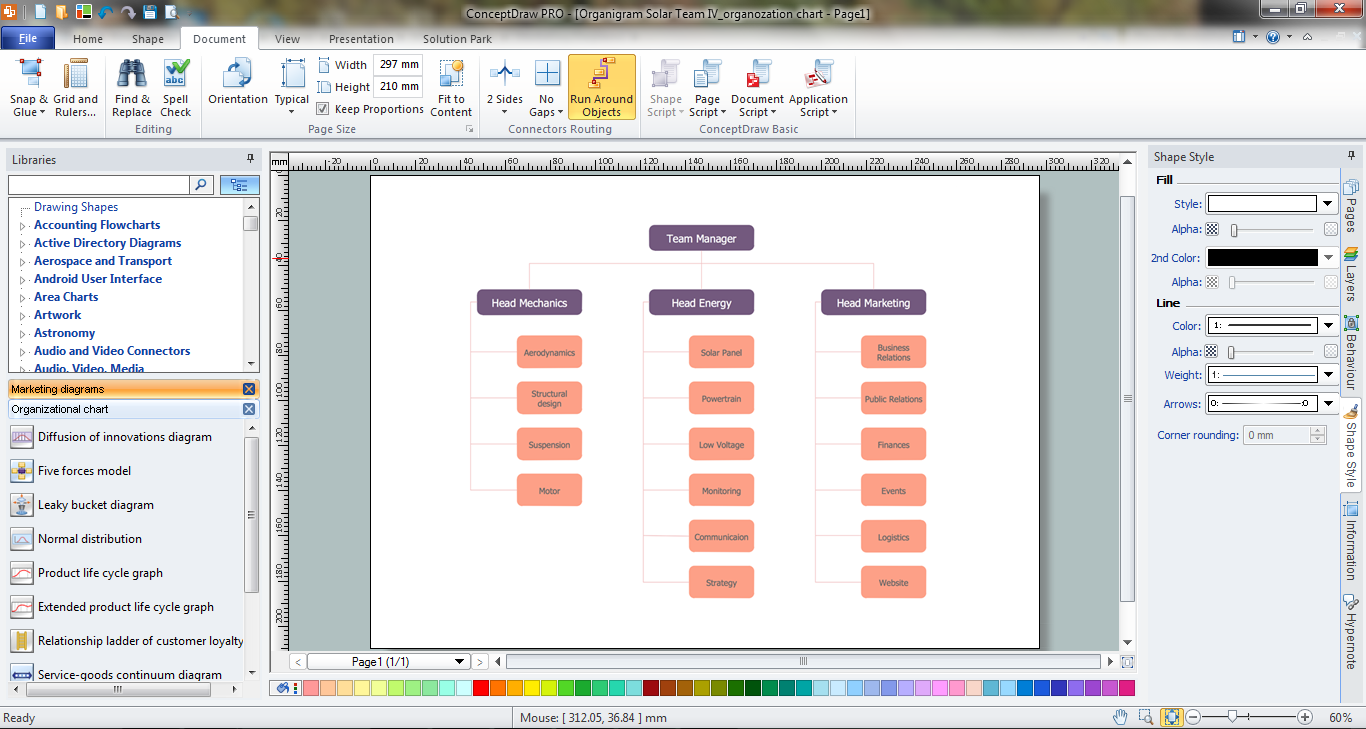
How to Create Marketing Diagrams
Marketing diagrams created in ConceptDraw DIAGRAM are a great tool to communicate marketing messages and simplify visualization of large amounts of data. Marketing diagrams can be used to show and analogize market-related data and relationships, and to monitor market variability over time.Marketing Flow Chart
ConceptDraw DIAGRAM diagramming and vector drawing software extended with Marketing Diagrams Solution from the Marketing Area of ConceptDraw Solution Park is the best software for quick and easy creating Marketing Flow Chart of any complexity and design.Pyramid Diagram
A triangular graphic representing Graham's "hierarchy of disagreement", based on Paul Graham's March 2008 essay "How to Disagree".Export from ConceptDraw DIAGRAM Document to a Graphic File
Now it’s easy to share your visual documents with other people in a form most convenient for them.ConceptDraw DIAGRAM can save your drawings and diagrams in a number of highly useful formats, including graphic files. You can save your drawing as a.PNG,.JPG, or other graphic format file.
Market Chart
ConceptDraw DIAGRAM is a powerful diagramming and vector drawing software. Each Market Chart designed in it is professional looking, attractive and successful in using thanks to the Marketing Diagrams Solution included in Marketing Area of ConceptDraw Solution Park.Marketing Organization Chart
You need design the Marketing Organization Chart and look for effective software? Now it's incredibly easy to do this in ConceptDraw DIAGRAM which was supplied with Marketing Diagrams Solution from the Marketing Area of ConceptDraw Solution Park.How to Create a Pyramid Diagram
ConceptDraw Pyramid Diagram software allows drawing column charts using predesigned objects or drawing tools. In ConceptDraw Pyramid Diagram software you can find a complete set of column chart tools and objects.Create Graphs and Charts
Charting Software allows you to create diagrams, charts, graphs, flowcharts, and other business graphics. ConceptDraw DIAGRAM include simple shape drawing tools, examples, templates, and symbol libraries.Best Diagramming
Need to draw a diagram, process chart, flowchart, organizational chart, graphic design? ConceptDraw can help you to make professional graphic documents quickly.Pyramid Diagram
A five level pyramid model of different types of Information Systems based on the information processing requirement of different levels in the organization.five level pyramid example is included in the Pyramid Diagrams solution from Marketing area of ConceptDraw Solution Park.
- Funnel Diagrams | Marketing Sales Funnel Examples | Marketing ...
- Graphical User Interface Examples | Data Flow Diagrams | Flow ...
- Graphic Design Organization Chart
- Marketing Charts | Marketing Flow Chart | Best Diagramming ...
- Marketing Flow Chart | Competitor Analysis | Flowchart Example ...
- Composition Conversion Of Graphics Pie Chart Pdf
- KPI Dashboard | KPIs and Metrics | Business Graphics Software ...
- Pie Chart Marketing Mix Products
- Research cycle - Circle diagram | Export from ConceptDraw PRO ...
- Market Analysis Venn Diagram
- ERD | Entity Relationship Diagrams, ERD Software for Mac and Win
- Flowchart | Basic Flowchart Symbols and Meaning
- Flowchart | Flowchart Design - Symbols, Shapes, Stencils and Icons
- Flowchart | Flow Chart Symbols
- Electrical | Electrical Drawing - Wiring and Circuits Schematics
- Flowchart | Common Flowchart Symbols