HelpDesk
What Information to be Displayed in the ConceptDraw PROJECT Gantt Chart View

HelpDesk
How to Customize the Appearance of the Project Window

How to Discover Critical Path on a Gantt Chart

HelpDesk
How to Change the Timescale in a Gantt Chart View

Business Diagram Software


Examples of Flowcharts, Org Charts and More


Business diagrams & Org Charts with ConceptDraw DIAGRAM


HelpDesk
How to Set a Project Baseline

Chart Examples

 PM Presentations
The PM Presentations solution extends the power of ConceptDraw MINDMAP , ConceptDraw DIAGRAM , and ConceptDraw PROJECT, improving their efficiency at many stages of the project management process by using the same source data to construct the targeted presentation for your audience and clearly communicating the appropriate information to different audiences from a single source. It gives an ability to project managers and other team participants to create and to deliver capacious presentations representing the data and knowledge of a specific project with the help of including visual dashboards, Gantt charts, resource views, maps, timelines, calendars, illustrations, project diagrams and reports of varied types. Having the possibility to edit collaboratively in a Full-Screen Mode, the teams can rapidly plan a project as well as execute the tasks of revising and making changes to it.
Chart Templates

Product Overview

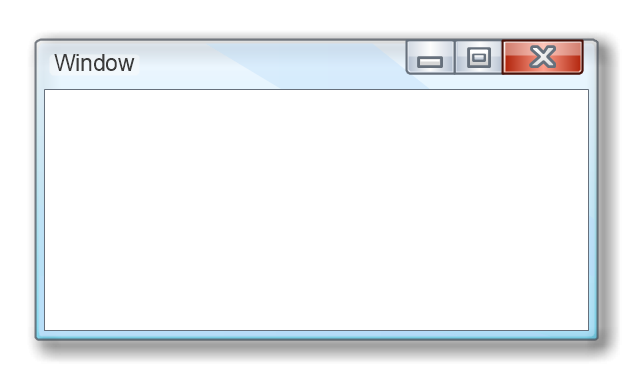
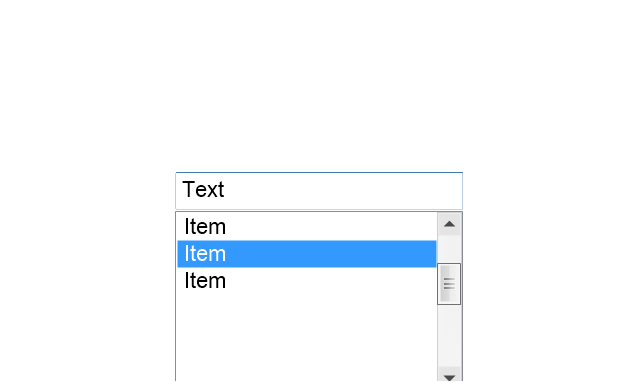
The vector stencils library "MS Windows Vista user interface" contains 76 MS Windows Vista design elements.
Use it for designing Microsoft ribbon graphic user interface (GUI) of software for computers with MS Windows Vista OS in the ConceptDraw PRO diagramming and vector drawing software extended with the Graphic User Interface solution from the Software Development area of ConceptDraw Solution Park.
Use it for designing Microsoft ribbon graphic user interface (GUI) of software for computers with MS Windows Vista OS in the ConceptDraw PRO diagramming and vector drawing software extended with the Graphic User Interface solution from the Software Development area of ConceptDraw Solution Park.
Window
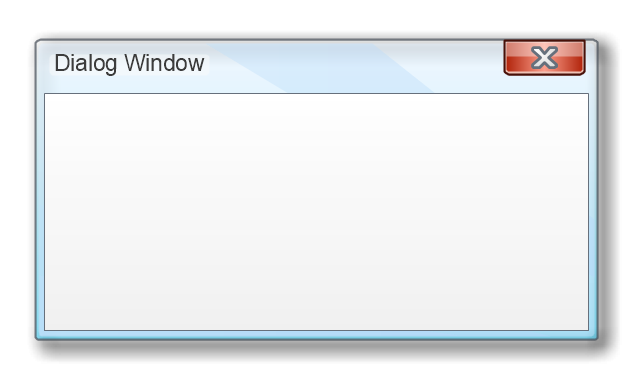
Dialog Window
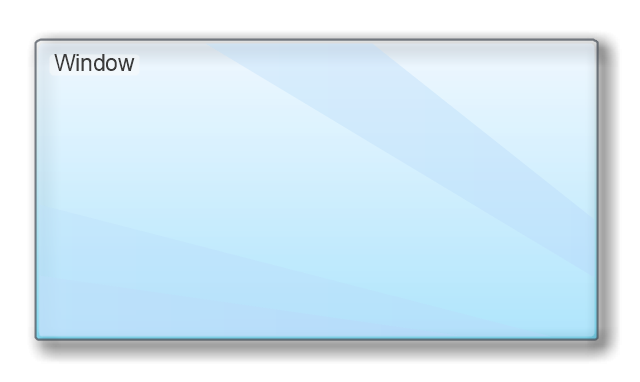
Empty Window
Field

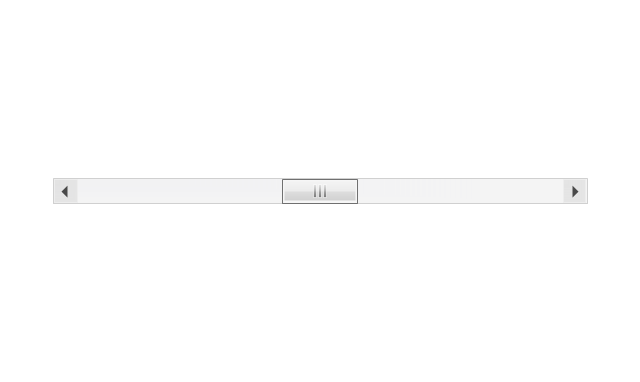
Horizontal Scrollbar
Vertical Scrollbar
Window Buttons
Window Buttons
Window Button 1

Window Button 2

Window Button 3
Window Button 4

Navigation

Menu Bar
Gradient Menu Bar
Drop-down Menu
Button
Toolbar Pannel
Tool Button
Primary Toolbar

Toolbar 1
Toolbar 2
Customizable Tollbar

Tab View
List View
Text Field
Vertical Separator

Horizontal Separator

Group Box
Text Label

Link

Line Edit
Search

Search with Button

Spin Box
Combo-box
Editable Combo-box
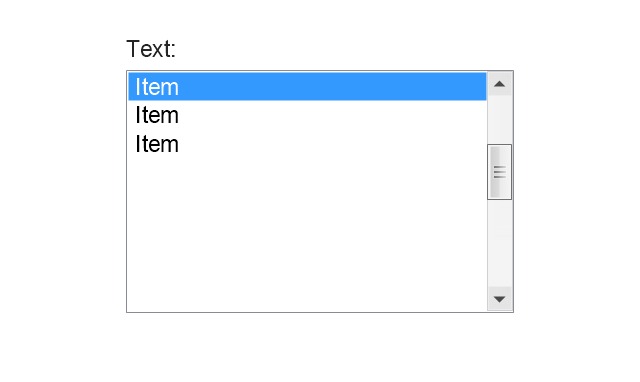
Editable List Box
List Box
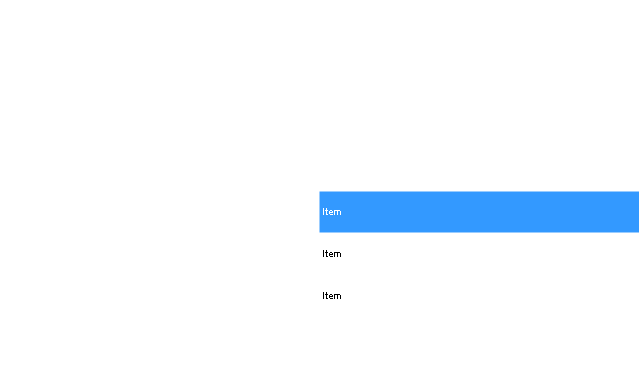
Single-selection List
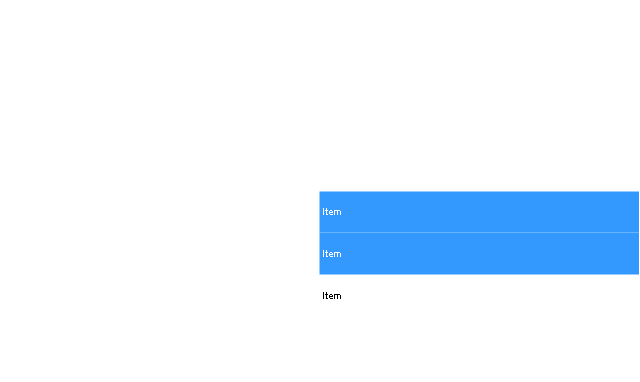
Multiple-selection List
Check Box
Radio Button
Check box group
Radio Buttons Group
Progress Bar

Modal Progress Bar

Vertical Slider with Ticks
Horizontal Slider with Ticks
Dial
Catalogue Tree
Tree View 1
Tree View 2
Vertical Spacer

Horizontal Spacer

Chevron 1
Arrow 1
Arrow 2
Plus/Minus Control

Rotating Triangle

Chevron 3
Chevron 2
Normal Select Cursor

Link Select Cursor

Text Select Cursor

Working in Background Pointer

Busy Pointer

Unavailable Cursor

Precision Select Cursor

Error Icon
Warning Icon
Information Icon
Question Mark Icon
Balloon
Tooltip/Infotip

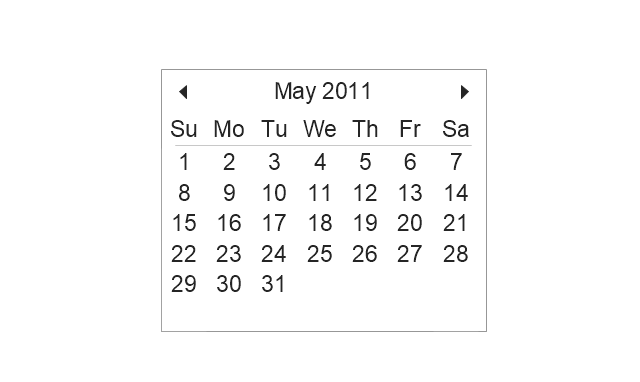
Calendar
Product Overview

Project Reports — Planning Reports

Flowchart Design Flowchart Symbols, Shapes, Stencils and Icons

HelpDesk
How to Customize the Default Project File on PC

 Business Intelligence Dashboard
Business Intelligence Dashboard solution extends the ConceptDraw DIAGRAM functionality with exclusive tools, numerous ready-to-use vector objects, samples and quick-start templates for creation professional Business Intelligence Dashboards, Business Intelligence Graphics, Business Intelligence Charts and Maps of different kinds. Design easy the BI dashboard, BI model or Dynamic chart in ConceptDraw DIAGRAM to monitor the company's work, to track the indicators corresponding your company's data, to display and analyze key performance indicators, to evaluate the trends and regularities of the processes occurring at the company.
 Cash Flow Reports
The Cash Flow Reports solution extends the ConceptDraw PROJECT software with the abilities to generate three kinds of management reports in a form of spreadsheets: Cash Flow on Projects, Cash Flow on Resources, and Cash Flow on Tasks. Use them to monitor and to control the cash flow in projects and multiprojects, the project expenses by days, by resources, by tasks, and to analyze effectively the project progress and the compliance of project finances to allocated budget. Having a full content and ideal view, these reports are popular with the project planning and project management teams, project participants, team leaders, and project managers which have the need for demonstrating the steps of work on projects and reporting about project progress in printed reports or on a large screen. The projects examples included in this solution are illustrative and perfectly suit for comprehending all the solution's capabilities.
- Project —Task Trees and Dependencies | Gantt Chart Dependencies
- How To Plan and Implement Projects Faster | Gantt chart examples
- Gantt Chart Software | Project — Working With Costs | Product ...
- How to Create and Customize a Calendar | Blank Calendar | How to ...
- Activity Network Diagram Method | Activity Network (PERT) Chart ...
- How to Make a Mind Map from a Project Gantt Chart | How to Quickly ...
- Create Response Charts | Diagrams Mean Nothing | Software ...
- How to Create Gantt Chart | How to Connect an Image to a Topic in ...
- Workflow Diagram Software | Software Diagrams | Software ...
- Examples of Flowcharts, Org Charts and More | Basic Flowchart ...