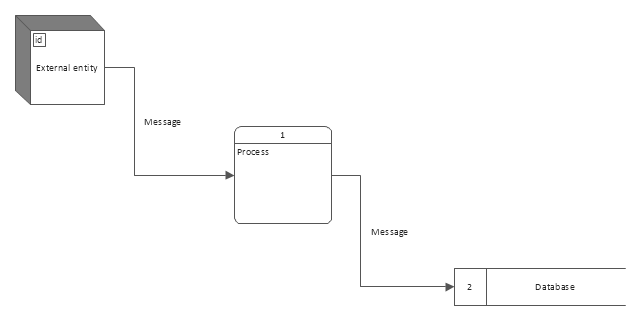
Gane Sarson Diagram

Use this template to create your data flow diagrams (DFD) by Gane-Sarson (DFD) notation using the ConceptDraw PRO diagramming and vector drawing software extended with the Data Flow Diagrams solution from the Software Development area of ConceptDraw Solution Park.
DFD template
The vector stencils library "DFD, Gane-Sarson notation" contains 12 DFD elements.
Use it for drawing data flow diagrams (DFD) using Gane-Sarson notation in the ConceptDraw PRO diagramming and vector drawing software extended with the Data Flow Diagrams solution from the Software Development area of ConceptDraw Solution Park.
Use it for drawing data flow diagrams (DFD) using Gane-Sarson notation in the ConceptDraw PRO diagramming and vector drawing software extended with the Data Flow Diagrams solution from the Software Development area of ConceptDraw Solution Park.
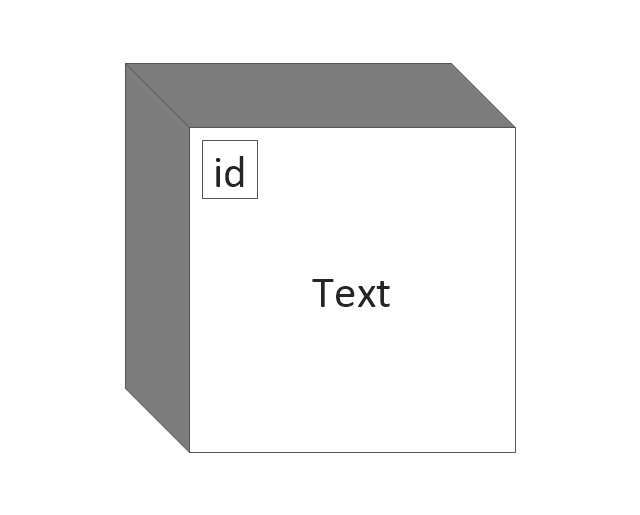
External Entity
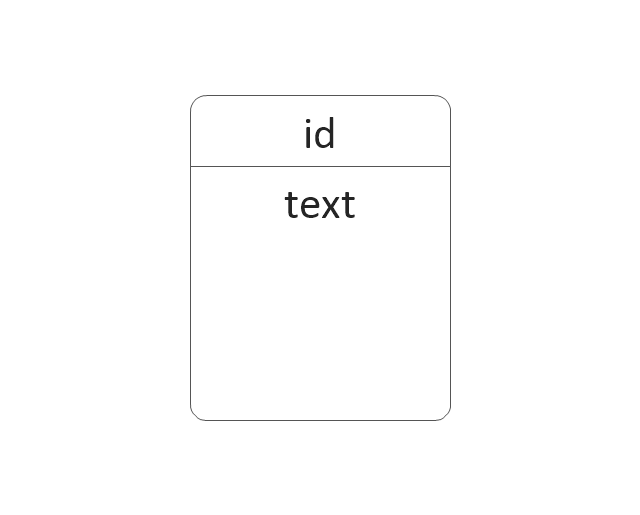
Process
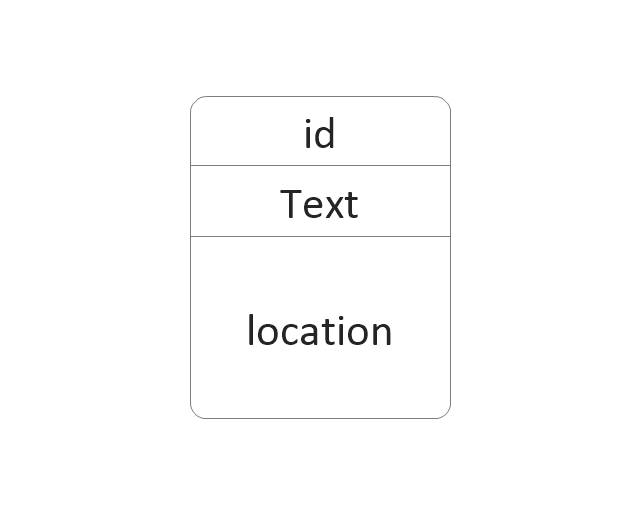
Process w / Location
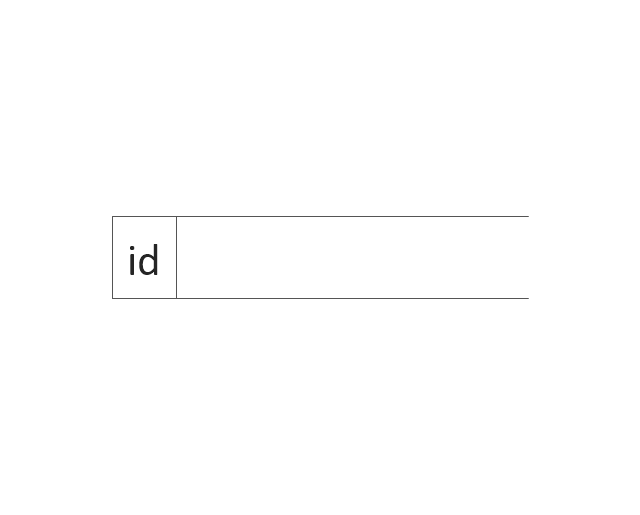
Data Store
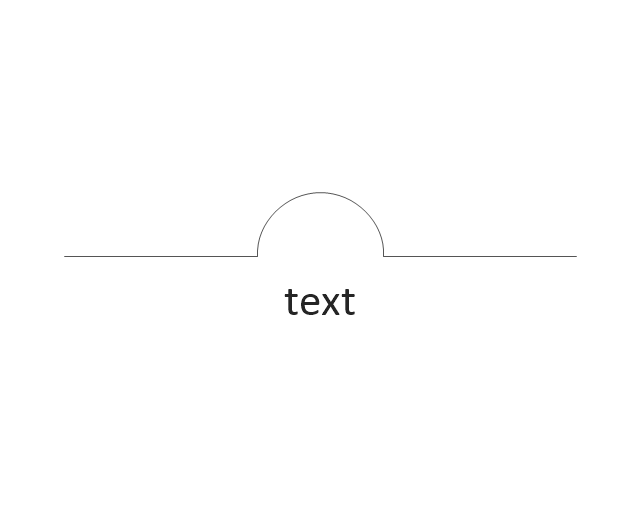
Jump
Angled Connector
Angled Connector 2
Top to Bottom Variable
Bottom to Side
Side to Side
Side to Same Side
Top to Top Side
Object-Oriented Development (OOD) Method
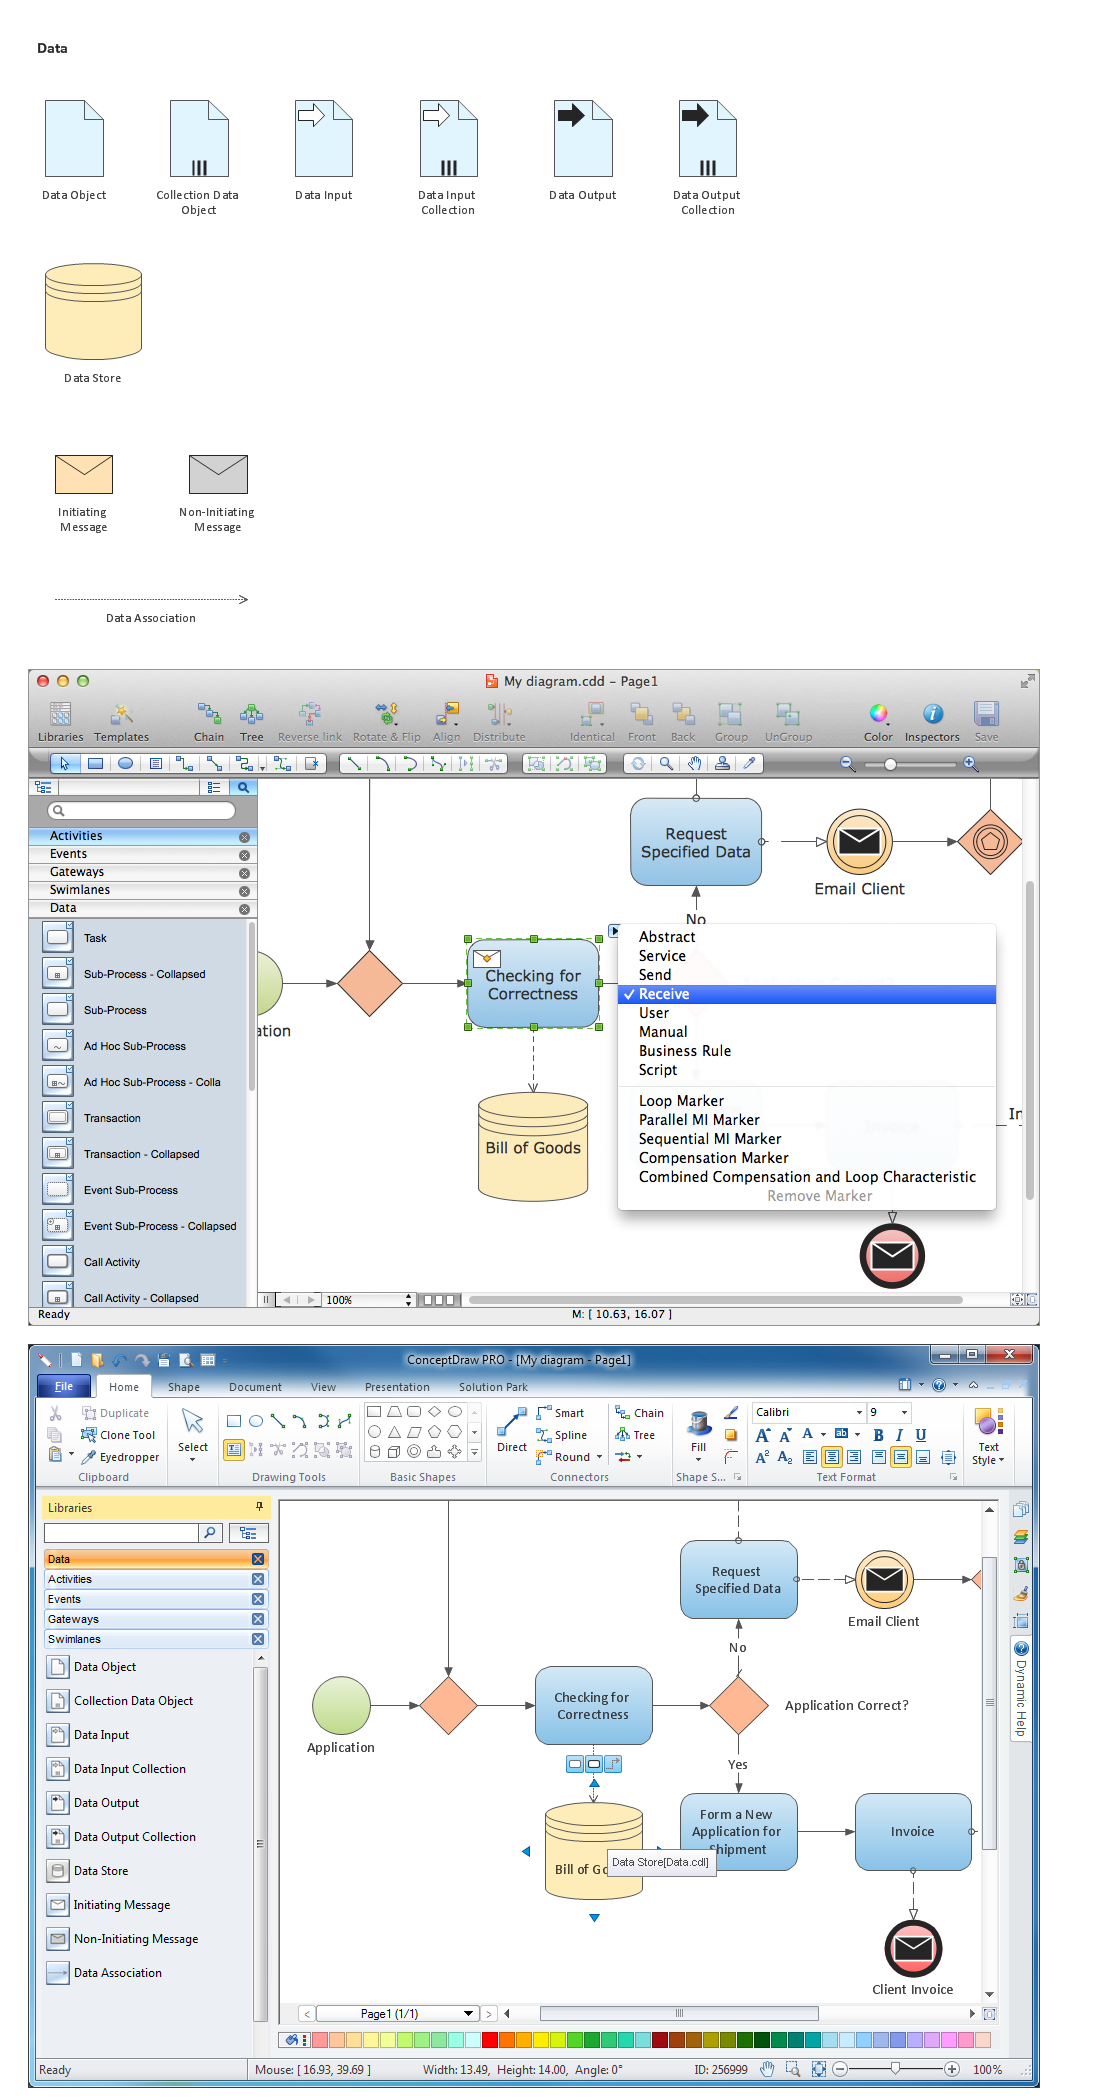
Diagramming Software for Business Process

Structured Systems Analysis and Design Method (SSADM) with ConceptDraw DIAGRAM

Data Flow Diagram Symbols. DFD Library

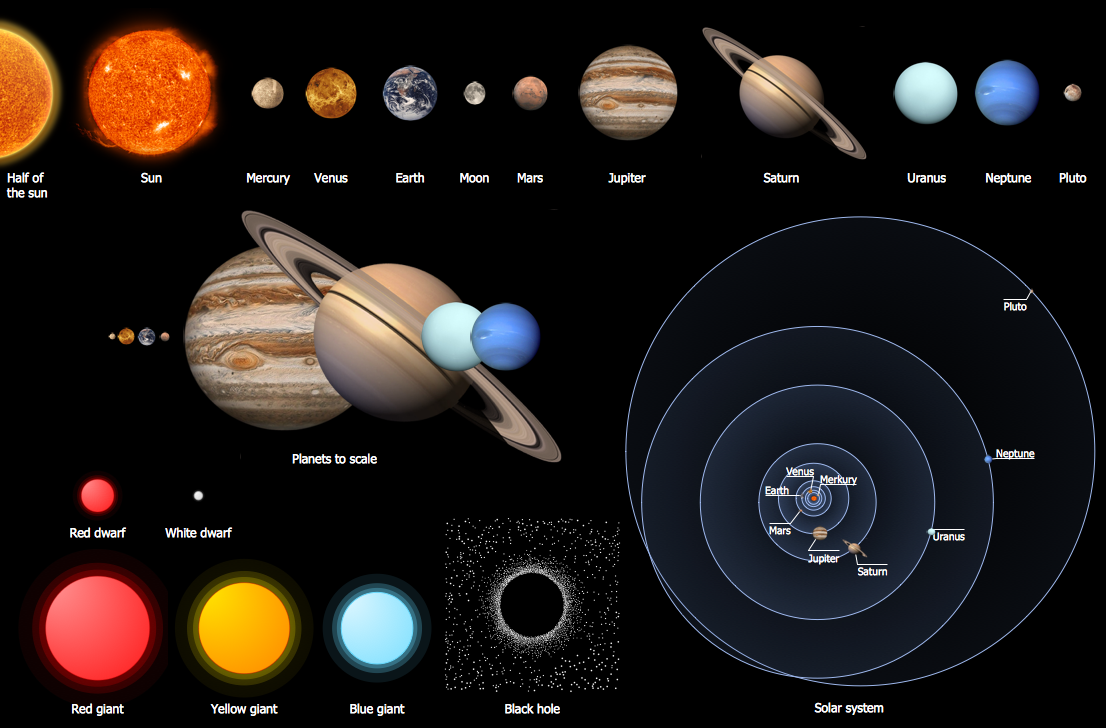
Solar System Symbols
Data Flow Diagrams

Example of DFD for Online Store (Data Flow Diagram)


- Gane Sarson Diagram | DFD, Gane - Sarson notation - Template ...
- DFD, Gane - Sarson notation - Vector stencils library | Gane Sarson ...
- Gane Sarson Tutorial
- DFD, Gane - Sarson notation - Vector stencils library | DFD, Gane ...
- Gane Sarson Diagram | Data Flow Diagram Symbols. DFD Library ...
- Download A Gane Sarson Diagram Template
- ConceptDraw PRO DFD Software | Dfd Gane Sarson Notation ...
- Gane Sarson Diagram | Structured Systems Analysis and Design ...
- DFD, Gane - Sarson notation - Template
- Gane And Sarson Symbols