"In mathematics, the Euclidean algorithm, or Euclid's algorithm, is a method for computing the greatest common divisor (GCD) of two (usually positive) integers, also known as the greatest common factor (GCF) or highest common factor (HCF). ...
The GCD of two positive integers is the largest integer that divides both of them without leaving a remainder (the GCD of two integers in general is defined in a more subtle way).
In its simplest form, Euclid's algorithm starts with a pair of positive integers, and forms a new pair that consists of the smaller number and the difference between the larger and smaller numbers. The process repeats until the numbers in the pair are equal. That number then is the greatest common divisor of the original pair of integers.
The main principle is that the GCD does not change if the smaller number is subtracted from the larger number. ... Since the larger of the two numbers is reduced, repeating this process gives successively smaller numbers, so this repetition will necessarily stop sooner or later - when the numbers are equal (if the process is attempted once more, one of the numbers will become 0)." [Euclidean algorithm. Wikipedia]
The flowchart example "Euclidean algorithm" was created using the ConceptDraw PRO diagramming and vector drawing software extended with the Mathematics solution from the Science and Education area of ConceptDraw Solution Park.
Euclid's algorithm flow chart

Basic Flowchart Symbols and Meaning


Diagram Flow Chart

Types of Flowcharts


Flowchart Components

"In elementary algebra, a quadratic equation (from the Latin quadratus for "square") is any equation having the form
ax^2+bx+c=0
where x represents an unknown, and a, b, and c are constants with a not equal to 0. If a = 0, then the equation is linear, not quadratic. The constants a, b, and c are called, respectively, the quadratic coefficient, the linear coefficient and the constant or free term.
Because the quadratic equation involves only one unknown, it is called "univariate". The quadratic equation only contains powers of x that are non-negative integers, and therefore it is a polynomial equation, and in particular it is a second degree polynomial equation since the greatest power is two.
Quadratic equations can be solved by a process known in American English as factoring and in other varieties of English as factorising, by completing the square, by using the quadratic formula, or by graphing." [Quadratic equation. Wikipedia]
The flowchart example "Solving quadratic equation algorithm" was created using the ConceptDraw PRO diagramming and vector drawing software extended with the Mathematics solution from the Science and Education area of ConceptDraw Solution Park.
Solving quadratic equation flow chart

Contoh Flowchart

Flowchart on Bank. Flowchart Examples


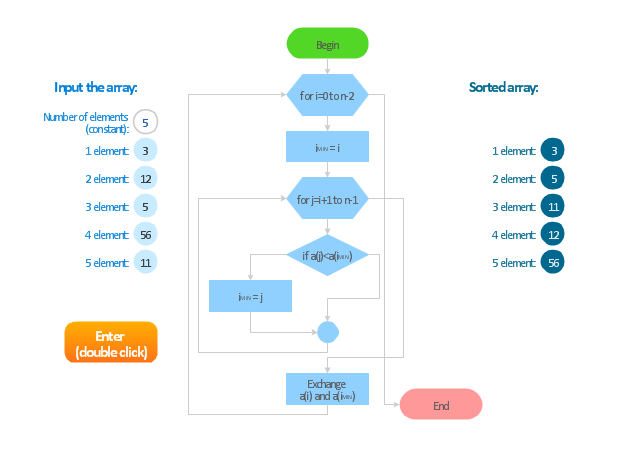
"In mathematics and computer science, an algorithm ... is a step-by-step procedure for calculations. Algorithms are used for calculation, data processing, and automated reasoning.
An algorithm is an effective method expressed as a finite list of well-defined instructions for calculating a function. Starting from an initial state and initial input (perhaps empty), the instructions describe a computation that, when executed, proceeds through a finite number of well-defined successive states, eventually producing "output" and terminating at a final ending state. The transition from one state to the next is not necessarily deterministic; some algorithms, known as randomized algorithms, incorporate random input." [Algorithm. Wikipedia]
The algorithm flow chart example "Selection sorting method" was created using the ConceptDraw PRO diagramming and vector drawing software extended with the Flowcharts solution from the area "What is a Diagram" of ConceptDraw Solution Park.
Flowchart - Selection sorting method
Business process Flow Chart — Event-Driven Process chain (EPC) diagrams

- Algorithm Power Function Flow Chart
- Characteristics Of Algorithm And Flowchart
- Power Function Flow Chart
- Example Problem Statement For Algorithm And Flowchart
- Solving quadratic equation algorithm - Flowchart | Algorithm And ...
- Draw A Flowchart Using Pow Function
- Algorithm Flowchart Download Free Draw
- Similarities Between Flow Chart And Algorithm
- Function Of Money In Flow Chart
- Hotel Management System Algorithm And Flowchart