 Fault Tree Analysis Diagrams
This solution extends ConceptDraw PRO v9.5 or later with templates, fault tree analysis example, samples and a library of vector design elements for drawing FTA diagrams (or negative analytical trees), cause and effect diagrams and fault tree diagrams.
The FTA diagram sample "Fault tree analysis - Insulin delivery system" was redesigned from the illustration of "CMSI 641: Introduction to Software Engineering. Design of Critical Systems. B.J. Johnson. 2005. Loyola Marymount University".
"Another way of assessing hazards is using fault tree analysis. In this process, each of the identified hazards is covered by a detailed analysis to find out what might cause it. Either inductive or deductive reasoning is applied. In the case of software hazards, the usual focus is to determine faults that will cause the system to fail to deliver a system service, such as a monitoring system. A "fault tree" is constructed to link all the possible situations together, to help identify the interrelationships of the failures, which modules may cause them, and what "trickle-down effects" there might be. Here is an example of a fault tree, as applied to the Insulin delivery system from Sommerville...
Note that this tree is only partially complete, since only the potential software faults are shown on the diagram. The potential failures involving hardware, such as low battery, blood monitor or sensor failure, patient over-exertion or inattention, or medical staff failure are noticeable by their absence.
The fault tree and safety specification processes are two ways of helping with system risk assessment tasks. Once the risks are identified, there are other assessments that need to take place. First, the likelihood of the risk occurrance must be assessed. This is often quantifiable, so numbers may be assigned based on things like MTBF, latency effects, and other known entities. There may be other non-quantifiable contributors to the risk likelihood, however, such that these must be assessed and estimated by experts in the domain. (Don't short-change this process when dealing with critical systems!) Finally, the risk assessment must include the severity of the risk, meaning an estimation of the cost to the project in the event the risk item actually does occur. "Cost to the project" means all associated costs, including schedule delays, human injury, damage to hardware, corruption of data, and so on."
[myweb.lmu.edu/ bjohnson/ cmsi641web/ week15-2.html]
The FTA diagram example "Fault tree analysis - Insulin delivery system" was created using the ConceptDraw PRO diagramming and vector drawing software extended with the Fault Tree Analysis Diagrams solution from the Engineering area of ConceptDraw Solution Park.
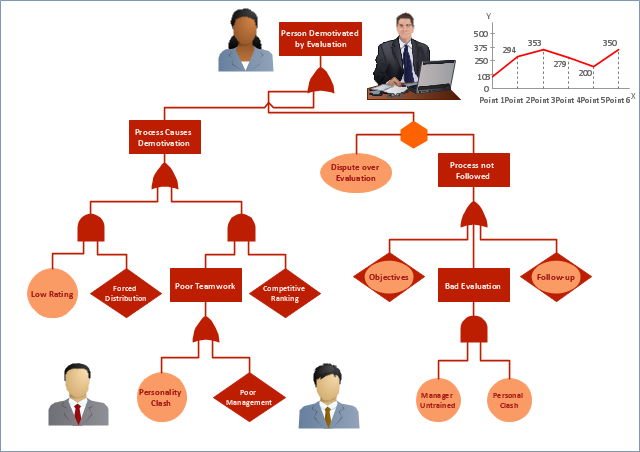
FTA diagram

Fault Tree Analysis Example

Graphics Software for Business
 diagram")
Software with different flowchart templates for each type of business will be your lifesaver. ConceptDraw PRO with its business samples, libraries and design elements is a point to start.
HelpDesk
How to Create a Fault Tree Analysis Diagram (FTD) in ConceptDraw PRO

Fault Tree Analysis Software

First of all, Fault Tree Analysis Diagrams Solution provides a set of samples which are the good examples of easy drawing professional looking Fault Tree Analysis Diagrams.
Fault Tree Diagram

Fault tree analysis diagrams solution extends ConceptDraw PRO software with templates, samples and library of vector stencils for drawing the FTA diagrams.
Fault Tree
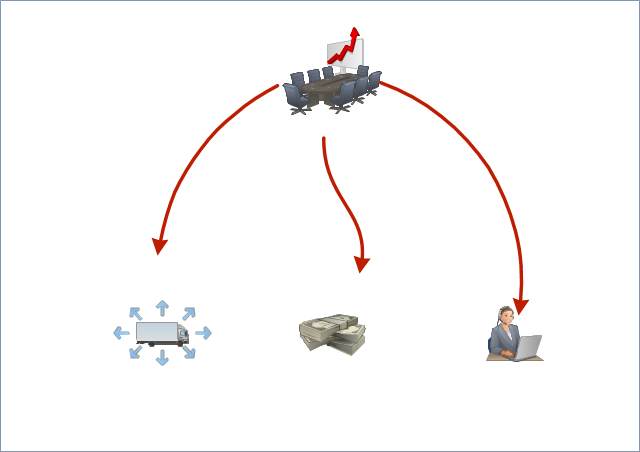
Workflow
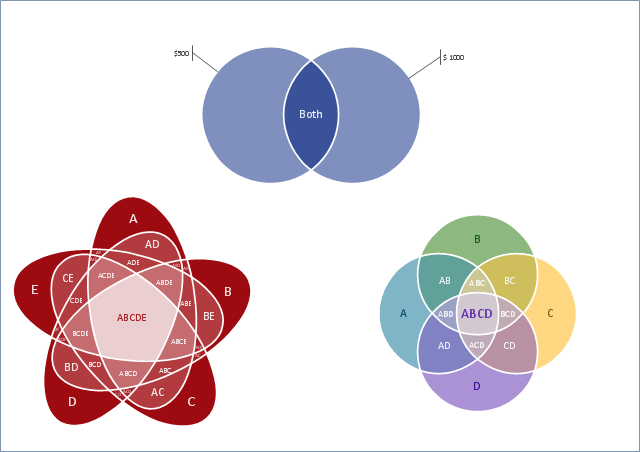
Cash Venn
Used Solutions
- FTA diagram - Hazard analysis | Accident analytic tree - FTA ...
- Fishbone Diagram | Fault Tree Analysis Diagrams | TOWS analysis ...
- Fault Tree Analysis Diagrams | Fault tree analysis diagram template
- Fault Tree Analysis Diagrams | Fault tree analysis ( FTA ) diagram ...
- Fault Tree Diagram Software
- FTA diagram - Hazard analysis | Design elements - Fault tree ...
- Root cause analysis tree diagram template | Fault Tree Diagram ...
- Fault tree analysis ( FTA ) diagram template
- Fault tree analysis diagrams
- Fault tree analysis ( FTA ) diagram template | Graphics Software for ...
- In case of fire | UML Collaboration Diagram Example Illustration ...
- Fault Tree Analysis Diagrams | Root cause analysis tree diagram ...
- Root cause analysis tree diagram - Manufacturing problem solution
- Fault Tree Diagram
- Fault Tree Analysis Diagrams | Seven Management and Planning ...
- Fault tree analysis diagram template | Graphics Software for ...
- Fault tree analysis diagram template | Business Productivity ...
- Fault Tree Analysis Diagrams | ConceptDraw Solution Park | SWOT ...
- Tree Network Topology Diagram | Fault Tree Analysis Diagrams ...
- Design elements - Fault tree analysis diagrams | Fault Tree Diagram ...