This work flow chart sample was redesigned from the picture "Weather Forecast" from the article "Simulation Workflows".
[iaas.uni-stuttgart.de/ forschung/ projects/ simtech/ sim-workflows.php]
"(1) The weather is predicted for a particular geological area. Hence, the workflow is fed with a model of the geophysical environment of ground, air and water for a requested area.
(2) Over a specified period of time (e.g. 6 hours) several different variables are measured and observed. Ground stations, ships, airplanes, weather balloons, satellites and buoys measure the air pressure, air/ water temperature, wind velocity, air humidity, vertical temperature profiles, cloud velocity, rain fall, and more.
(3) This data needs to be collected from the different sources and stored for later access.
(4) The collected data is analyzed and transformed into a common format (e.g. Fahrenheit to Celsius scale). The normalized values are used to create the current state of the atmosphere.
(5) Then, a numerical weather forecast is made based on mathematical-physical models (e.g. GFS - Global Forecast System, UKMO - United Kingdom MOdel, GME - global model of Deutscher Wetterdienst). The environmental area needs to be discretized beforehand using grid cells. The physical parameters measured in Step 2 are exposed in 3D space as timely function. This leads to a system of partial differential equations reflecting the physical relations that is solved numerically.
(6) The results of the numerical models are complemented with a statistical interpretation (e.g. with MOS - Model-Output-Statistics). That means the forecast result of the numerical models is compared to statistical weather data. Known forecast failures are corrected.
(7) The numerical post-processing is done with DMO (Direct Model Output): the numerical results are interpolated for specific geological locations.
(8) Additionally, a statistical post-processing step removes failures of measuring devices (e.g. using KALMAN filters).
(9) The statistical interpretation and the numerical results are then observed and interpreted by meteorologists based on their subjective experiences.
(10) Finally, the weather forecast is visualized and presented to interested people." [iaas.uni-stuttgart.de/ forschung/ projects/ simtech/ sim-workflows.php]
The example "Workflow diagram - Weather forecast" was drawn using the ConceptDraw PRO diagramming and vector drawing software extended with the Workflow Diagrams solution from the Business Processes area of ConceptDraw Solution Park.
Work flow chart

Sales Process Flowchart Symbols

Line Chart Template for Word

This sample shows the Line Chart of annual percentage change. The Line Chart allows you to clearly see the changes of data over the time.
Competitor Analysis

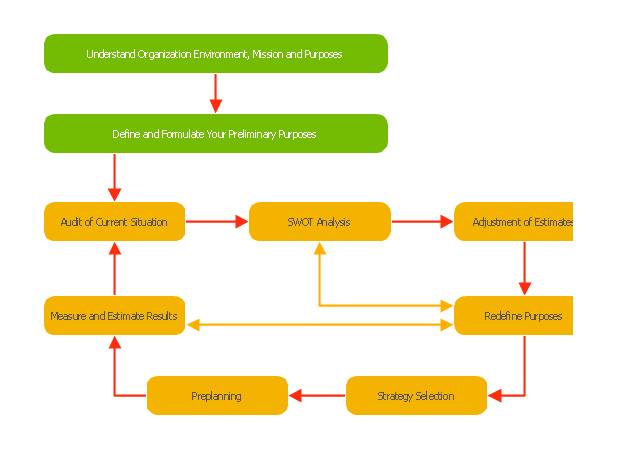
"Planning (also called forethought) is the process of thinking about and organizing the activities required to achieve a desired goal.
Planning involves the creation and maintenance of a plan. As such, planning is a fundamental property of intelligent behavior. This thought process is essential to the creation and refinement of a plan, or integration of it with other plans; that is, it combines forecasting of developments with the preparation of scenarios of how to react to them.
An important, albeit often ignored aspect of planning, is the relationship it holds with forecasting. Forecasting can be described as predicting what the future will look like, whereas planning predicts what the future should look like. The counterpart to planning is spontaneous order." [Planning. Wikipedia]
The block diagram example "Planning process" was created using the ConceptDraw PRO diagramming and vector drawing software extended with the Block Diagrams solution from the area "What is a Diagram" of ConceptDraw Solution Park.
Block diagram
Money - Design Elements

Various styles of money design elements (currency symbols, clipart, money symbols) can be found in ConceptDraw PRO Business and Finance Solution.
- Workflow diagram - Weather forecast | Types of Flowcharts | Line ...
- Process Flowchart | Workflow Diagrams | Types of Flowcharts | Data ...
- Satellite Flowchart
- Process Flowchart | Workflow diagram - Weather forecast | Basic ...
- Work Flow Chart | Workflow Diagram Software | Types of Flowcharts ...
- Workflow diagram - Weather forecast | How can you illustrate the ...
- How to Draw an Effective Workflow | Flow chart Example ...
- Workflow diagram - Weather forecast | Workflow Diagram Software ...
- Process Flow Chart Symbols | How can you illustrate the weather ...
- EPC - Business Processes in Terms of Work Flows | Flow chart ...
- Block diagram - Planning process | Project planning process ...
- Give A Diagram Of A Weather Forecasting
- Basic Flowchart Symbols and Meaning | Flow chart Example ...
- How to Create a Release Burn-Down Chart Using ConceptDraw ...
- Block diagram - Planning process | Process Flowchart | Office ...
- Block Diagram Creator | Process Flowchart | Engineering | Block ...
- Block diagram - Planning process | Block Diagrams | Process ...
- Block diagram - Planning process | ConceptDraw Solution Park ...
- Basic Flowchart Symbols and Meaning | Process Flowchart | Flow ...
- Block diagram - Planning process | Process Flowchart | Process ...