This site uses cookies. By continuing to browse the ConceptDraw site you are agreeing to our Use of Site Cookies.

How to Draw ER Diagrams

How to Draw ER Diagrams? With Entity-Relationship Diagram (ERD) solution from the Software Development Area for ConceptDraw Solution Park you are able to draw ER diagram with no problem. It includes 45 predesigned icons advocated by popular Chen's and Crow’s Foot notations that can be used when describing an enterprise database.

Entity Relationship Diagram - ERD - Software for Design Crows Foot ER Diagrams

Crow's Foot notation was proposed by Gordon Everest. According to this notation, the entity is represented by rectangle, relation is depicted by line which ties two entities involved in a relationship. Entity-relationship diagrams based on both Chen's and Crow's Foot notations, can be easily drawn using the ConceptDraw DIAGRAM ERD diagrams software tools for design element Crow's Foot and Chen from Entity-Relationship Diagram (ERD) solution.
How to Build an Entity Relationship Diagram (ERD)

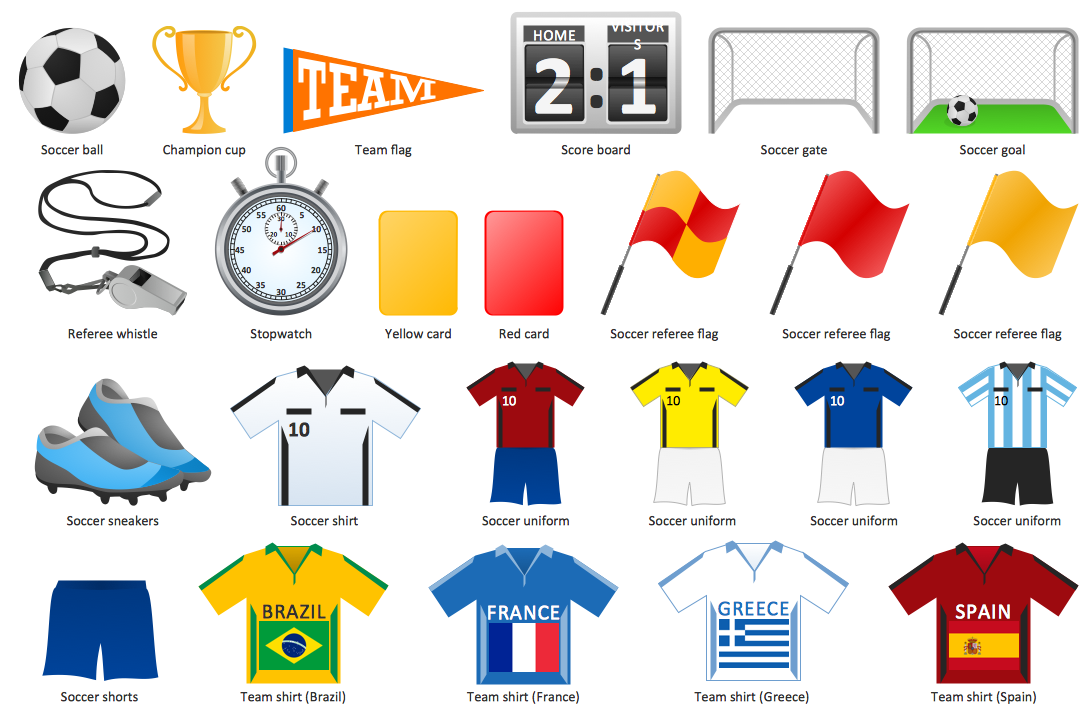
Soccer (Football) Illustrated

It’s very important that your soccer drawing looked beautiful, interesting and attracted the attention. For this it is necessary add the illustrations! The Soccer solution delivers several libraries with predesigned bright and interesting clipart objects

entity-relationship diagram, ER-diagram, database ERD Entity-Relationship Diagram (ERD)

entity-relationship diagram, ER-diagram, database ERD
An Entity-Relationship Diagram (ERD) is a visual presentation of entities and relationships. That type of diagrams is often used in the semi-structured or unstructured data in databases and information systems. At first glance ERD is similar to a flowch

Developing Entity Relationship Diagrams

When you need to visually represent the structure of relational database, Entity relationship diagram (ERD) is a type of diagram for that case.
Most entity-relationship diagrams can be built with objects from Flowchart solution or ERD Solution which contains inbuilt templates. Follow these steps to create your own custom ERD diagram.
Don't be frightened if it looks complex, ConceptDraw DIAGRAM makes it easy to create an ERD, and hundreds of other diagrams, in minutes.

Education Information

The Education Information is multifariuos and can be often represented in various forms. Еру the most successful ways of presentation the information and data are various illustrations, diagrams and colorful education infographics which you can easily make in ConceptDraw DIAGRAM software extended with Education Infographics Solution from the Business Infographics Area.

Entity Relationship Diagram Software for Mac

One of the most popular semantic data models is the "entity-relationship" model (often called ER-model). Most of the modern approaches to the database (mainly relational) design are based on the usage of different versions of ER- model. Domain modeling is based on the use of graphic charts, including a small number of heterogeneous components. The simplicity and the presentation clarity of the conceptual basis of these ER-model schemes led to its widespread deployment in the CASE-systems that support automatic design of relational databases.
A relation is a graphically depicted association between two entities. As well as the entity, a relation is a typical concept, all instances of the linked entity types are subject to the rules established by the connecting. Therefore, it is more correct to speak about the relationship type made between types of entities and about the instances of relationship types made between instances of the entity type. In common ER-model this association is a

ConceptDraw DIAGRAM Database Modeling Software

ConceptDraw DIAGRAM is a very easy-to-use and intuitive database design tool which can save you hundreds of work hours. See database diagram samples created with ConceptDraw DIAGRAM database modeling database diagram software.

Example of DFD for Online Store (Data Flow Diagram)

Data flow diagrams (DFDs) reveal relationships among and between the various components in a program or system. DFDs are an important technique for modeling a system’s high-level detail by showing how input data is transformed to output results through a sequence of functional transformations.
Example of DFD for Online Store shows the Data Flow Diagram for online store and interactions between the Visitors, Customers and Sellers, as well as Website Information and User databases.
Steps to Creating a Sales Process Flow Chart

Data Flow Diagrams

ConceptDraw DIAGRAM software enables you to quickly create data flow diagrams that include data storage, external entities, functional transforms, data flows, and control transforms and signals.