This site uses cookies. By continuing to browse the ConceptDraw site you are agreeing to our Use of Site Cookies.

Process Flowchart

The main reason of using Process Flowchart or PFD is to show relations between major parts of the system. Process Flowcharts are used in process engineering and chemical industry where there is a requirement of depicting relationships between major components only and not include minor parts. Process Flowcharts for single unit or multiple units differ in their structure and implementation. ConceptDraw DIAGRAM is Professional business process mapping software for making Process flowcharts, Process flow diagram, Workflow diagram, flowcharts and technical illustrations for business documents and also comprehensive visio for mac application. Easier define and document basic work and data flows, financial, production and quality management processes to increase efficiency of your business with ConcepDraw DIAGRAM. Business process mapping software with Flowchart Maker ConceptDraw DIAGRAM includes extensive drawing tools, rich examples and templates, process flowchart symbols and shape libraries, smart connectors that allow you create the flowcharts of complex processes, process flow diagrams, procedures and information exchange. Process Flowchart Solution is project management workflow tools which is part ConceptDraw Project marketing project management software. Drawing charts, diagrams, and network layouts has long been the monopoly of Microsoft Visio, making Mac users to struggle when needing such visio alternative like visio for mac, it requires only to view features, make a minor edit to, or print a diagram or chart. Thankfully to MS Visio alternative like ConceptDraw DIAGRAM software, this is cross-platform charting and business process management tool, now visio alternative for making sort of visio diagram is not a problem anymore however many people still name it business process visio tools.
How To Create a Process Flow Chart (business process modelling techniques)

Data Flow Diagram

Data Flow Diagram (DFD) is the part of the Structured Systems Analysis and Design Methodology (SSADM), which is intended for information systems projection and analysis. Data Flow Diagrams allow graphically represent the data flows in information system and analyze the data processing during the structural projection. This type of diagrams lets visually show a work of information system and results of this work, it is often used in connection with human processes and can be displayed as Workflow diagram. Data Flow Diagram visualizes processes and functions, external entities, data depositories, and data flows connecting these elements and indicating direction and data character. Each of these elements used for DFD has its own graphical notation. There are two notations to draw DFDs - Yourdon & Coad and Gane & Sarson. ConceptDraw DIAGRAM extended with Data Flow Diagrams (DFD) solution from Software Developmant area is ideal for designing professional looking DFDs, which can be then easily exported in various formats.

flow chart software, flowchart maker, flowchart, flow chart Flowcharts

flow chart software, flowchart maker, flowchart, flow chart
The Flowcharts solution for ConceptDraw DIAGRAM is a comprehensive set of examples and samples in several varied color themes for professionals that need to represent graphically a process. Solution value is added by the basic flow chart template and shapes' libraries of flowchart notation. ConceptDraw DIAGRAM flow chart creator lets one depict the processes of any complexity and length, as well as design the Flowchart either vertically or horizontally.
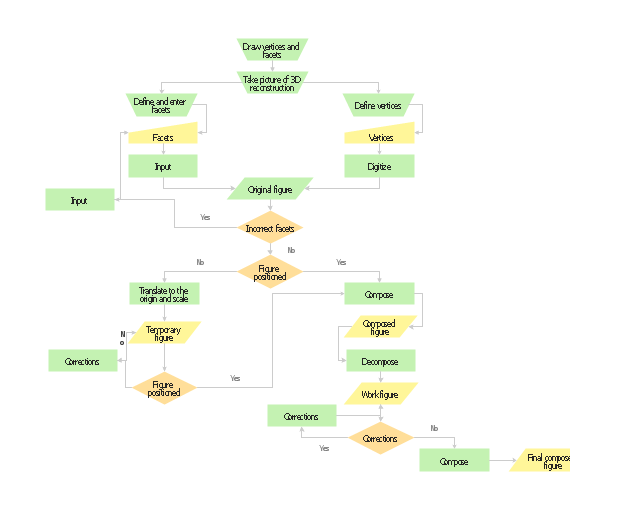
Planning scheme for the construction of a synthetic object.
"Computer-generated imagery (CGI) ... is the application of computer graphics to create or contribute to images in art, printed media, video games, films, television programs, commercials, and simulators. The visual scenes may be dynamic or static, and may be two-dimensional (2D), though the term "CGI" is most commonly used to refer to 3D computer graphics used for creating scenes or special effects in films and television." [Computer-generated imagery. Wikipedia]
The flow chart example "Synthetic object construction" was created using the ConceptDraw PRO diagramming and vector drawing software extended with the Flowcharts solution from the area "What is a Diagram" of ConceptDraw Solution Park.
Flowchart - Synthetic object construction
Flowchart - Synthetic object construction, process, manual operation, manual input, decision, data,
Used Solutions

Marketing and Sales Organization chart. Organization chart Example

The use of Organization Charts is very popular at the fields of marketing and sales. They help to depict in a visual form a lot of information about organization: the company's structure, relationships of positions within an organization in terms of authorities and responsibilities, and company's strategies. All Organizational Charts are constructed from the similar building blocks (rectangles and lines), this makes them easily for interpretation and understanding by all interested people inside and outside of this company, such as shareholders, employees, investors, distributors, suppliers, customers, etc. Organization Charts can be hand-drawn on the paper, however the preferable is to use a special software. ConceptDraw DIAGRAM diagramming and vector graphics software extended with useful Organizational Charts solution is ideal for easy representing information and data, and professional drawing Marketing and Sales Organization Chart with any depth of detailing. Organizational structure may differ during the company's development, you can design and compare the charts on each stage.

Activity on Node Network Diagramming Tool

Activity on Node Network Diagramming Tool — Activity Network and Project Evaluation and Review Technique, or PERT, charts are a way of documenting and analyzing the tasks in a project. This sample shows the Activity on node network diagramming method. It was created in ConceptDraw DIAGRAM diagramming and vector drawing software using the Seven Management and Planning Tools solution from the Management area of ConceptDraw Solution Park.

How to Draw a Computer Network Diagrams

ConceptDraw DIAGRAM enhanced with popular Computer Network Diagrams solution from Computer and Networks area of ConceptDraw Solution Park is a powerful vector graphics and computer network diagramming software. It includes templates, samples and 7 libraries with predesigned vector objects of computer network devices, computer peripheral devices, network hardware, external digital devices, internet symbols, logical symbols, to help IT professionals easily visualize network equipment, to draft and present computer and network installations. It assists create easy and even instantly Computer Network Diagrams of various types and complexity, design Wireless Network Schemes, Network Topologies Diagrams, Computer Network System Designs. The list of five the most popular practical applications of Computer Network Diagrams solution includes documentation, presentations, training, workflows, education. A represented video How to Draw a Computer Network Diagram will help to realize effectively your computer network design process.

histogram, flow chart, pareto chart, fishbone diagram, quality control Seven Basic Tools of Quality

histogram, flow chart, pareto chart, fishbone diagram, quality control
Manage quality control in the workplace, using fishbone diagrams, flowcharts, Pareto charts and histograms, provided by the Seven Basic Tools of Quality solution.

Building Drawing Software for Design Office Layout Plan

The building plans and blueprints are useful for designing and construction various premises, including definitely offices, small and large office buildings, and whole business centers. Comfort and convenience are the most important for office premises, they let configure on a working mood and increase the work productivity, so the architects and designers need to consider carefully all details. Often their construction on the paper is painstaking and labourious process, which doubly faster and easier to realize with the availability of specialized software, such as ConceptDraw DIAGRAM. Design of simple and extensive detailed Office Layout Plans, effective allocation a working space are easily with ConceptDraw DIAGRAM powerful vector diagramming and building drawing software tools, and ready-to-use vector design objects. Use they to develop the Office floor plans, Office layout plans, Blueprints for office space planning and furniture placement, Office electrical plans, Office emergency plans, etc. Thought Visio is not available for Mac, there are Visio alternatives which support MS Visio file formats. Try ConceptDraw DIAGRAM for both PC and Mac platforms to see its perpetual license privilege.
How to Draw a Floor Plan