 Travel Infographics
Travel Infographics solution greatly extends the ConceptDraw DIAGRAM functionality making it the best travel infographics design software. Being intended for all specialists in the travel sphere, travel agents, marketers, advertisers, PR specialists, travelers and all other people related with tourism and rest, it contains professionally-designed samples, travel infographics template, and libraries with large variety of ready-made travel infographic vector clipart, design objects and travel infographics icons for drawing exceptional travel infographics and business travel infographics, travel illustrations, presentations, diagrams, schematics, plans, maps, posters, billboards, advertising, marketing, and other materials on the subject of travel and tourism, outdoor activities and extreme sports.
Risk Diagram (Process Decision Program Chart)
 *")
This TQM diagram example was redesigned from the illustration of the Highway Performance Monitoring System (HPMS) Field Manual from the website of the Federal Highway Administration (FHWA).
[fhwa.dot.gov/ policyinformation/ hpms/ fieldmanual/ chapter7.cfm]
"Highway Performance Monitoring System (HPMS).
The HPMS is a national level highway information system that includes data on the extent, condition, performance, use and operating characteristics of the nation's highways. The HPMS contains administrative and extent of system information on all public roads, while information on other characteristics is represented in HPMS as a mix of universe and sample data for arterial and collector functional systems. Limited information on travel and paved miles is included in summary form for the lowest functional systems.
HPMS was developed in 1978 as a continuing database, replacing the special biennial condition studies that had been conducted since 1965. The HPMS has been modified several times since its inception. Changes have been made to reflect changes in the highway systems, legislation, and national priorities, to reflect new technology, and to consolidate or streamline reporting requirements." [fhwa.dot.gov/ policyinformation/ hpms.cfm]
The TQM flowchart example "Software workflow diagram" was created using the ConceptDraw PRO diagramming and vector drawing software extended with the Total Quality Management (TQM) Diagrams solution from the Quality area of ConceptDraw Solution Park.
TQM diagram

Infographic Maker

 ConceptDraw Solution Park
ConceptDraw Solution Park collects graphic extensions, examples and learning materials
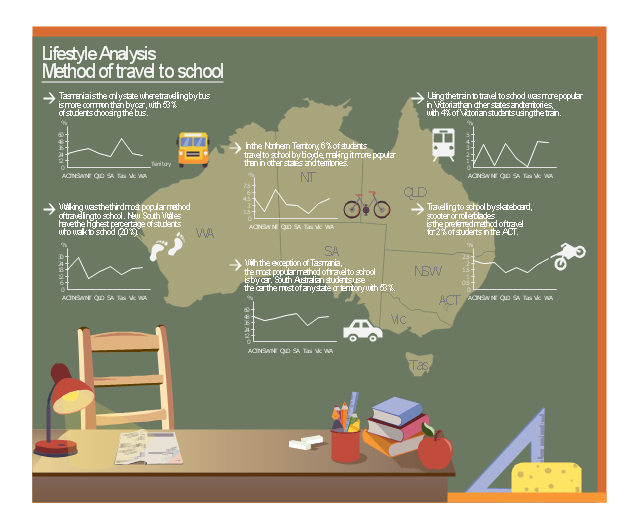
This example was designed on the base of infographic "Lifestyle Analysis. Method of travel to school in 2011" from the CensusAtSchool Australia website of the Australian Bureau of Statistics (ABS). [abs.gov.au/ websitedbs/ cashome.nsf/ 4a256353001af3ed4b2562bb00121564/ 41b786978bda4617ca25795d0004f35b/ $FILE/ ATT1ZZFV.pdf/ 1infographic_ travel_ 2011.pdf]
"National Summary Tables.
These tables indicate the trends, habits, attitudes and lifestyles of Australian students; however, they don't represent all Australian students, just those who voluntarily completed questionnaires. ...
Tables ... have infographics that you can view and download." [abs.gov.au/ websitedbs/ cashome.nsf/ 4a256353001af3ed4b2562bb00121564/ 1b426c2827e1d7f9ca2578db0015e3b1!OpenDocument]
The infographic example "Lifestyle analysis - Method of travel to school" was created using the ConceptDraw PRO diagramming and vector drawing software extended with the Education Infographics solition from the area "Business Infographics" in ConceptDraw Solution Park.
Educational infogram
Used Solutions
The vector stencils library "Travel and tourism pictograms" contains 20 travel and tourism pictograms.
Use it to create your infographics, illustrations and presentations.
The pictogram example "Design elements - Travel and tourism pictograms" was created using the ConceptDraw PRO diagramming and vector drawing software extended with the Pictorial infographics solution from the area "What is infographics" in ConceptDraw Solution Park.
Pictograms

This hotel computer reservations system cycle process chart example was redesigned from the Wikimedia Commons file: По-запросу.jpg.
[commons.wikimedia.org/ wiki/ File:По-запросу.jpg]
"A computer reservations system or central reservation system (CRS) is a computerized system used to store and retrieve information and conduct transactions related to air travel, hotels, car rental, or activities. ...
Modern GDSes typically allow users to book hotel rooms, rental cars, airline tickets as well as activities and tours." [en.wikipedia.org/ wiki/ Computer_ reservations_ system]
The cycle process diagram example "Hotel reservation system" was created using the ConceptDraw PRO diagramming and vector drawing software extended with the Sales Flowcharts solution from the Marketing area of ConceptDraw Solution Park.
Hotel computer reservation system - Cycle process diagram

Pictorial Chart

Accounting Flowchart Purchasing Receiving Payable and Payment

Process Flow Chart Symbols

 Packages Area
We are excited to introduce a new Bundles Catalogue, where ConceptDraw products are paired together or offered with thematic set of paid solutions.
Flow Diagrams

Flow Chart Creator

 Customer Journey Mapping
Customer Journey Mapping Solution for ConceptDraw DIAGRAM opens incredibly broad opportunities for marketing and business specialists, product managers, designers, engineers, and other people interested in business development, increasing the product’s audience, its success and users' demand, providing them with capabilities of customer journey mapping. The included diagramming and customer journey mapping tools, predesigned vector customer journey mapping icons and charts, consumer journey mapping connectors, user journey and customer mapping figures, customer experience map icons and touchpoint icons, quick-start templates and samples provide excellent conditions for the customer journey mapping process, for creating Customer Journey Map and Customer Experience Map.
Process Flow Chart Symbol

Design Pictorial Infographics. Design Infographics

 Directional Maps
Directional Maps solution extends ConceptDraw DIAGRAM software with templates, samples and libraries of vector stencils for drawing the directional, location, site, transit, road and route maps, plans and schemes.
- Travel Infographics | Flow chart Example. Warehouse Flowchart
- Flow chart Example. Warehouse Flowchart | Contoh Dfd Travel
- Business Process Diagrams | Process Flow Chart For Travel Agency
- Process Flowchart | Travel and tourism pictograms - Vector stencils ...
- Business Process Diagrams | Travel Agency Flowchart
- Design elements - Travel and tourism pictograms | Process Flowchart
- Travel and tourism pictograms - Vector stencils library | Basic ...
- Accounting Data Flow from the Accounting Flowcharts Solution ...
- Business Process Diagrams | Data Flow Diagram Of Sales For ...