This site uses cookies. By continuing to browse the ConceptDraw site you are agreeing to our Use of Site Cookies.

Process Flowchart

ConceptDraw is Professional business process mapping software for making process flow diagram, workflow diagram, general flowcharts and technical illustrations for business documents. It is includes rich examples, templates, process flowchart symbols. ConceptDraw flowchart maker allows you to easier create a process flowchart. Use a variety of drawing tools, smart connectors, flowchart symbols and shape libraries to create flowcharts of complex processes, process flow diagrams, procedures and information exchange.
How To Create a Process Flow Chart (business process modelling techniques)

logistics flow charts, logistics planning, logistics and supply chain, logistics management software, inventory flow chart Logistics Flow Charts

logistics flow charts, logistics planning, logistics and supply chain, logistics management software, inventory flow chart
Logistics Flow Charts solution extends ConceptDraw PRO v11 functionality with opportunities of powerful logistics management software. It provides large collection of predesigned vector logistic symbols, pictograms, objects and clipart to help you design with pleasure Logistics flow chart, Logistics process flow diagram, Inventory flow chart, Warehouse flowchart, Warehouse management flow chart, Inventory control flowchart, or any other Logistics diagram. Use this solution for logistics planning, to reflect logistics activities and processes of an enterprise or firm, to depict the company's supply chains, to demonstrate the ways of enhancing the economic stability on the market, to realize logistics reforms and effective products' promotion.

Flow chart Example. Warehouse Flowchart

Warehouse Flowcharts are different diagrams describing wharehousing and inventory menagement processes. Typical purposes of warehouse flowcharts are evaluating warehouse performance and organizational performance, measuring efficiency of customer service. This type of workflow diagrams can be used for identifying any disconnection between business activities and business objectives.
Standard warehousing process flow diagram and standard workflow diagram used for process identification for further evaluating effectiveness and profitability of overall business process. Use the ConceptDraw PRO diagramming and vector drawing software extended with the Flowcharts solution from the Diagrams area of ConceptDraw Solution Park to design your own workflow diagrams, process flow diagram and flow charts. Need to use Process Flow Diagram for designing Warehouse packages flow.
ConceptDraw Arrows10 Technology
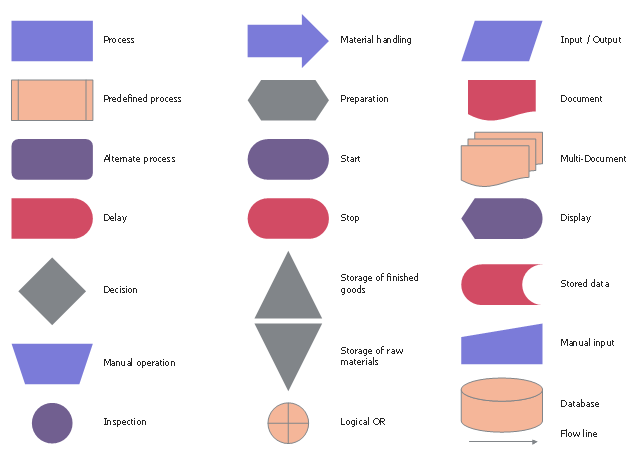
The vector stencils library "Flow chart" contains 22 flowchart notation symbols.
Use it to draw your flow charts with ConceptDraw PRO software.
The flowchart symbols example "Design elements - Flow chart" is included in Сlassic Business Process Modeling solution from Business Processes area of ConceptDraw Solution Park.
Vector stencils
Vector stencils, stored data, stop, start, terminator, raw materials storage, extract, measurement, process, step, operation, process, preparation, predefined process, multi-document, material handling, manual operation, manual input, logical OR, inspection, measurement, quality check, connector, input, output, data, flow line, arrow, connector, finished goods storage, merge, storage, document, display, delay, wait, decision, database, magnetic disk, alternate process,

Business Process Flowchart Symbols

The business process flowchart symbols used for business process mapping are predefined by Business Process Modeling Notation (BPMN) and actually have their roots in the data processing diagrams and programming flow charts. Business Process flowchart symbols provide drawing business process flowcharts, diagrams and maps of any complexity.

chemical engineering, process engineering, process flow diagram symbols, process and instrumentation diagram, process diagrams Chemical and Process Engineering

chemical engineering, process engineering, process flow diagram symbols, process and instrumentation diagram, process diagrams
This chemical engineering solution extends ConceptDraw PRO v.9.5 (or later) with process flow diagram symbols, samples, process diagrams templates and libraries of design elements for creating process and instrumentation diagrams, block flow diagrams (BFD

Material Requisition Flowchart. Flowchart Examples

Create your own material requisition flow charts using the ConceptDraw PRO diagramming and vector drawing software extended with the Flowcharts solution from the Diagrams area of ConceptDraw Solution Park.
The flowchart example shows the material requisition business process.

Value stream with ConceptDraw PRO

The Value stream is a totality of all actions on the projection, order composition and production: starting from creation a product project to launching this product, from order to delivery, from extraction of raw materials to ready product manufacturing. Value stream mapping is a process of visualization of these actions and creation of a detailed and graphical map.

Copying Service Process Flowchart. Flowchart Examples

This sample was created in ConceptDraw PRO diagramming and vector drawing software using the Flowcharts solution from the Diagrams area of ConceptDraw Solution Park.
This sample shows the Flowchart on that it is displayed the process of the determination the permissibility according the Access Copyright license. The diamonds represent the decision points. Inside the diamonds are the questions that need the answer yes/no. It is necessary to answer on the question, make the decision that will determine the next step.

fishbone diagram, Ishikawa diagram, cause and effect analysis Fishbone Diagrams

fishbone diagram, Ishikawa diagram, cause and effect analysis
The Fishbone Diagrams solution extends ConceptDraw PRO v10 software with the ability to easily draw the Fishbone Diagrams (Ishikawa Diagrams) to clearly see the cause and effect analysis and also problem solving. The vector graphic diagrams produced using this solution can be used in whitepapers, presentations, datasheets, posters, and published technical material.