Bar Diagrams for Problem Solving. Create space science bar charts with Bar Graphs Solution

Column Chart Software

Bar Charts

Venn Diagram Examples for Problem Solving. Computer Science. Chomsky Hierarchy

Bar Diagrams for Problem Solving. Create business management bar charts with Bar Graphs Solution

Rainfall Bar Chart

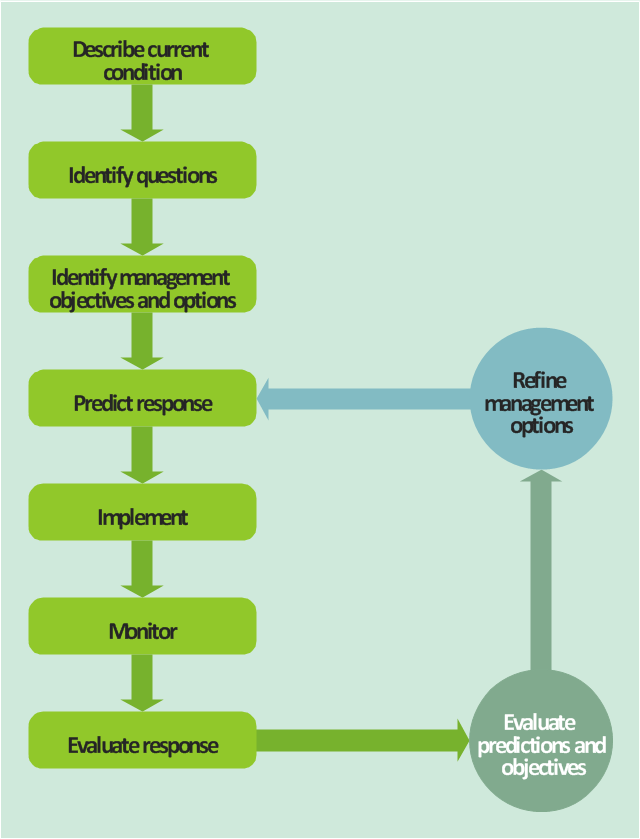
This TQM diagram sample was redesigned from the illustration of "Inland acid sulfate soil and water quality fact sheet" from website of the Department of the Environment of the Australian Government.
[environment.gov.au/ resource/ inland-acid-sulfate-soil-and-water-quality-fact-sheet]
"Adaptive management (AM), also known as adaptive resource management (ARM), is a structured, iterative process of robust decision making in the face of uncertainty, with an aim to reducing uncertainty over time via system monitoring. In this way, decision making simultaneously meets one or more resource management objectives and, either passively or actively, accrues information needed to improve future management. Adaptive management is a tool which should be used not only to change a system, but also to learn about the system (Holling 1978). Because adaptive management is based on a learning process, it improves long-run management outcomes. The challenge in using the adaptive management approach lies in finding the correct balance between gaining knowledge to improve management in the future and achieving the best short-term outcome based on current knowledge (Allan & Stankey 2009)." [Adaptive management. Wikipedia]
The TQM flowchart example "Acid sulfate soil adaptive management framework" was created using the ConceptDraw PRO diagramming and vector drawing software extended with the Total Quality Management (TQM) Diagrams solution from the Quality area of ConceptDraw Solution Park.
TQM diagram
Chemistry Drawings

UML Collaboration Diagram. Design Elements

Bar Graph

Bar Diagrams for Problem Solving. Create economics and financial bar charts with Bar Graphs Solution

Quality Management System

Bar Chart Examples

Total Quality Management

Geo Map - South America - Nicaragua

- Flowchart Of Type Of Soils With Example
- Draw A Pie Chart Illustrating The Soil Composition With Their ...
- Flowchart Showing Different Types Of Soils
- Images Of Bar Graph Of Different Types Of Soil
- Bar Diagrams for Problem Solving. Create space science bar charts ...
- Make A Flow Chart On Type Of Soils With Examples
- Draw A Pie Chart To Show The Composition Of An Ideal Soil
- Different Types Of Soils With Flow Chart
- Audit process flowchart (multipage) | Types of Flowchart - Overview ...
- Bar Diagrams for Problem Solving. Create space science bar charts ...
- Bar Graph Related To Soil
- Types Of Soil Percentage Bar Graph Pictures
- Types Of Bar Graphs
- Basic Flowchart Symbols and Meaning | Scientific Symbols Chart ...
- Pie Chart Drawing Soil
- Atmosphere air composition | Process Flowchart | Pie Chart About ...
- Process Flowchart | Basic Flowchart Symbols and Meaning | Cross ...
- Design elements - Composition charts and indicators | Composition ...
- Process Flowchart | How to Draw Chemistry Structures | Types of ...
- Basic Flowchart Symbols and Meaning | Basic Diagramming | Bar ...