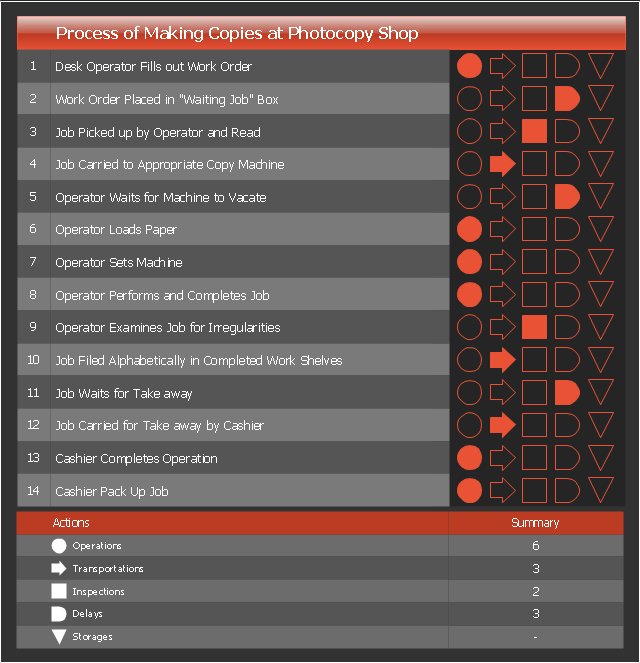
Flow process chart is used in quality control to display the action sequence of physical or manual process.
Flow process chart is useful for recording actions and documenting the production process.
Flow process chart helps to analyze and improve the process steps.
Flow process chart is more preferable than flowchart for documenting the mostly sequential processes.
Three types of flow process charts include: 1) man-type charts depicting the person actions, 2) material-type charts displaying the actions with product or material object, 3) equipment-type charts visualizing the useage of tools and equipment.
The set of symbols used in the flow process charts was developed by the American Society of Mechanical Engineers (ASME).
This flow process chart example was created using the ConceptDraw PRO diagramming and vector drawing software extended with the Matrices solution from the Marketing area of ConceptDraw Solution Park.
Flow process chart
Flow chart Example. Warehouse Flowchart


Campus Area Networks (CAN). Computer and Network Examples


Types of Welding in Flowchart

How to Draw a Computer Network Diagrams

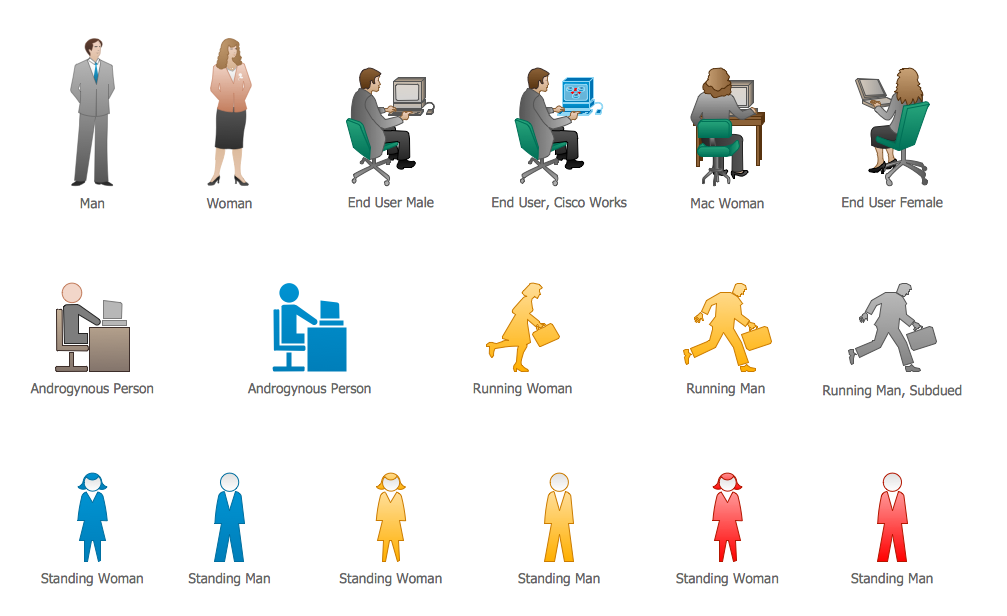
Cisco People. Cisco icons, shapes, stencils and symbols
Flow Chart for Olympic Sports

 Fishbone Diagrams
The Fishbone Diagrams solution extends ConceptDraw DIAGRAM software with the ability to easily draw the Fishbone Diagrams (Ishikawa Diagrams) to clearly see the cause and effect analysis and also problem solving. The vector graphic diagrams produced using this solution can be used in whitepapers, presentations, datasheets, posters, and published technical material.
Design Element: Computer and Network for Network Diagrams
.png)
Visual Presentations Made Easy with Diagramming Software


- What Is Man Type Flow Process Chart
- Difference In Man Type And Material Type Of Flow Chart
- Material Type Flow Process Chart
- Material Type Flow Type Process Chart
- Example Of Man Type Flow Process Chart
- Material Type Flow Process Chart Example
- 8m Method Machine Man Material
- Flow process chart | Business Process Flowchart Symbols | Material ...
- Flow Process Chart Man Type Examples
- Man Money Machine Material Method Management