Flow Chart Symbols

Data Flow Diagram Process

How to Draw EPC Diagram Quickly


 Event-driven Process Chain Diagrams
Event-Driven Process Chain Diagrams solution extends ConceptDraw DIAGRAM functionality with event driven process chain templates, samples of EPC engineering and modeling the business processes, and a vector shape library for drawing the EPC diagrams and EPC flowcharts of any complexity. It is one of EPC IT solutions that assist the marketing experts, business specialists, engineers, educators and researchers in resources planning and improving the business processes using the EPC flowchart or EPC diagram. Use the EPC solutions tools to construct the chain of events and functions, to illustrate the structure of a business process control flow, to describe people and tasks for execution the business processes, to identify the inefficient businesses processes and measures required to make them efficient.
 Basic Line Graphs
This solution extends the capabilities of ConceptDraw DIAGRAM (or later) with templates, samples and a library of vector stencils for drawing Line Graphs.
Subway infographic design elements - software tools

 Line Graphs
How to draw a Line Graph with ease? The Line Graphs solution extends the capabilities of ConceptDraw DIAGRAM with professionally designed templates, samples, and a library of vector stencils for drawing perfect Line Graphs.
UML Software
 Venn Diagrams
Venn Diagrams are actively used to illustrate simple set relationships in set theory and probability theory, logic and statistics, mathematics and computer science, linguistics, sociology, and marketing. Venn Diagrams are also often used to visually summarize the status and future viability of a project.
UML Diagramming Software
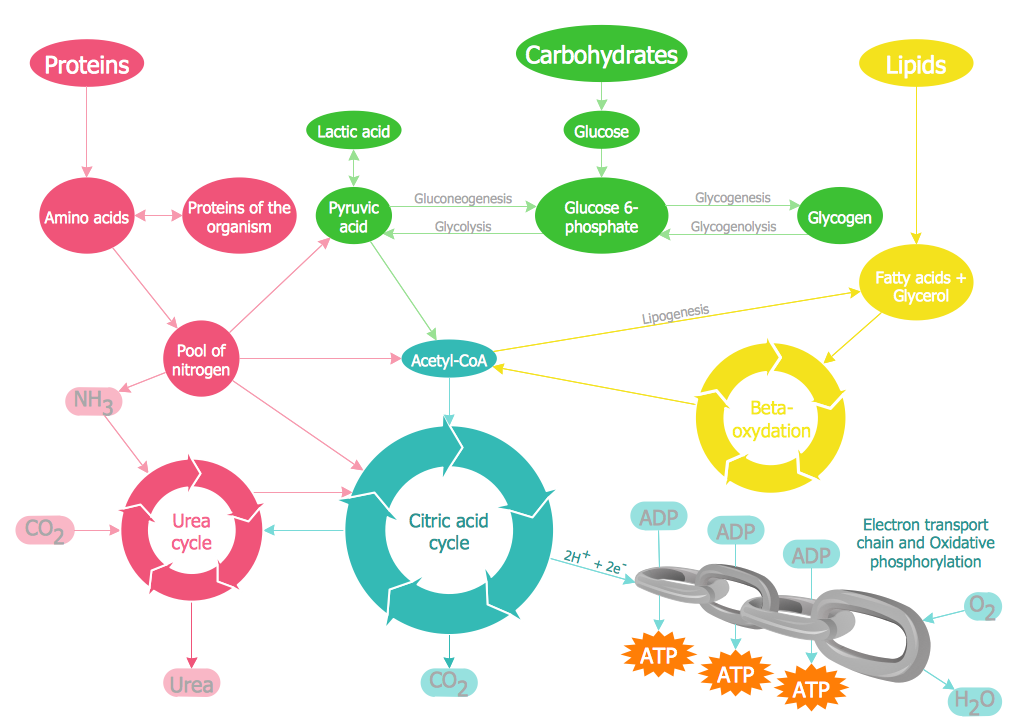
Biology Drawing Software

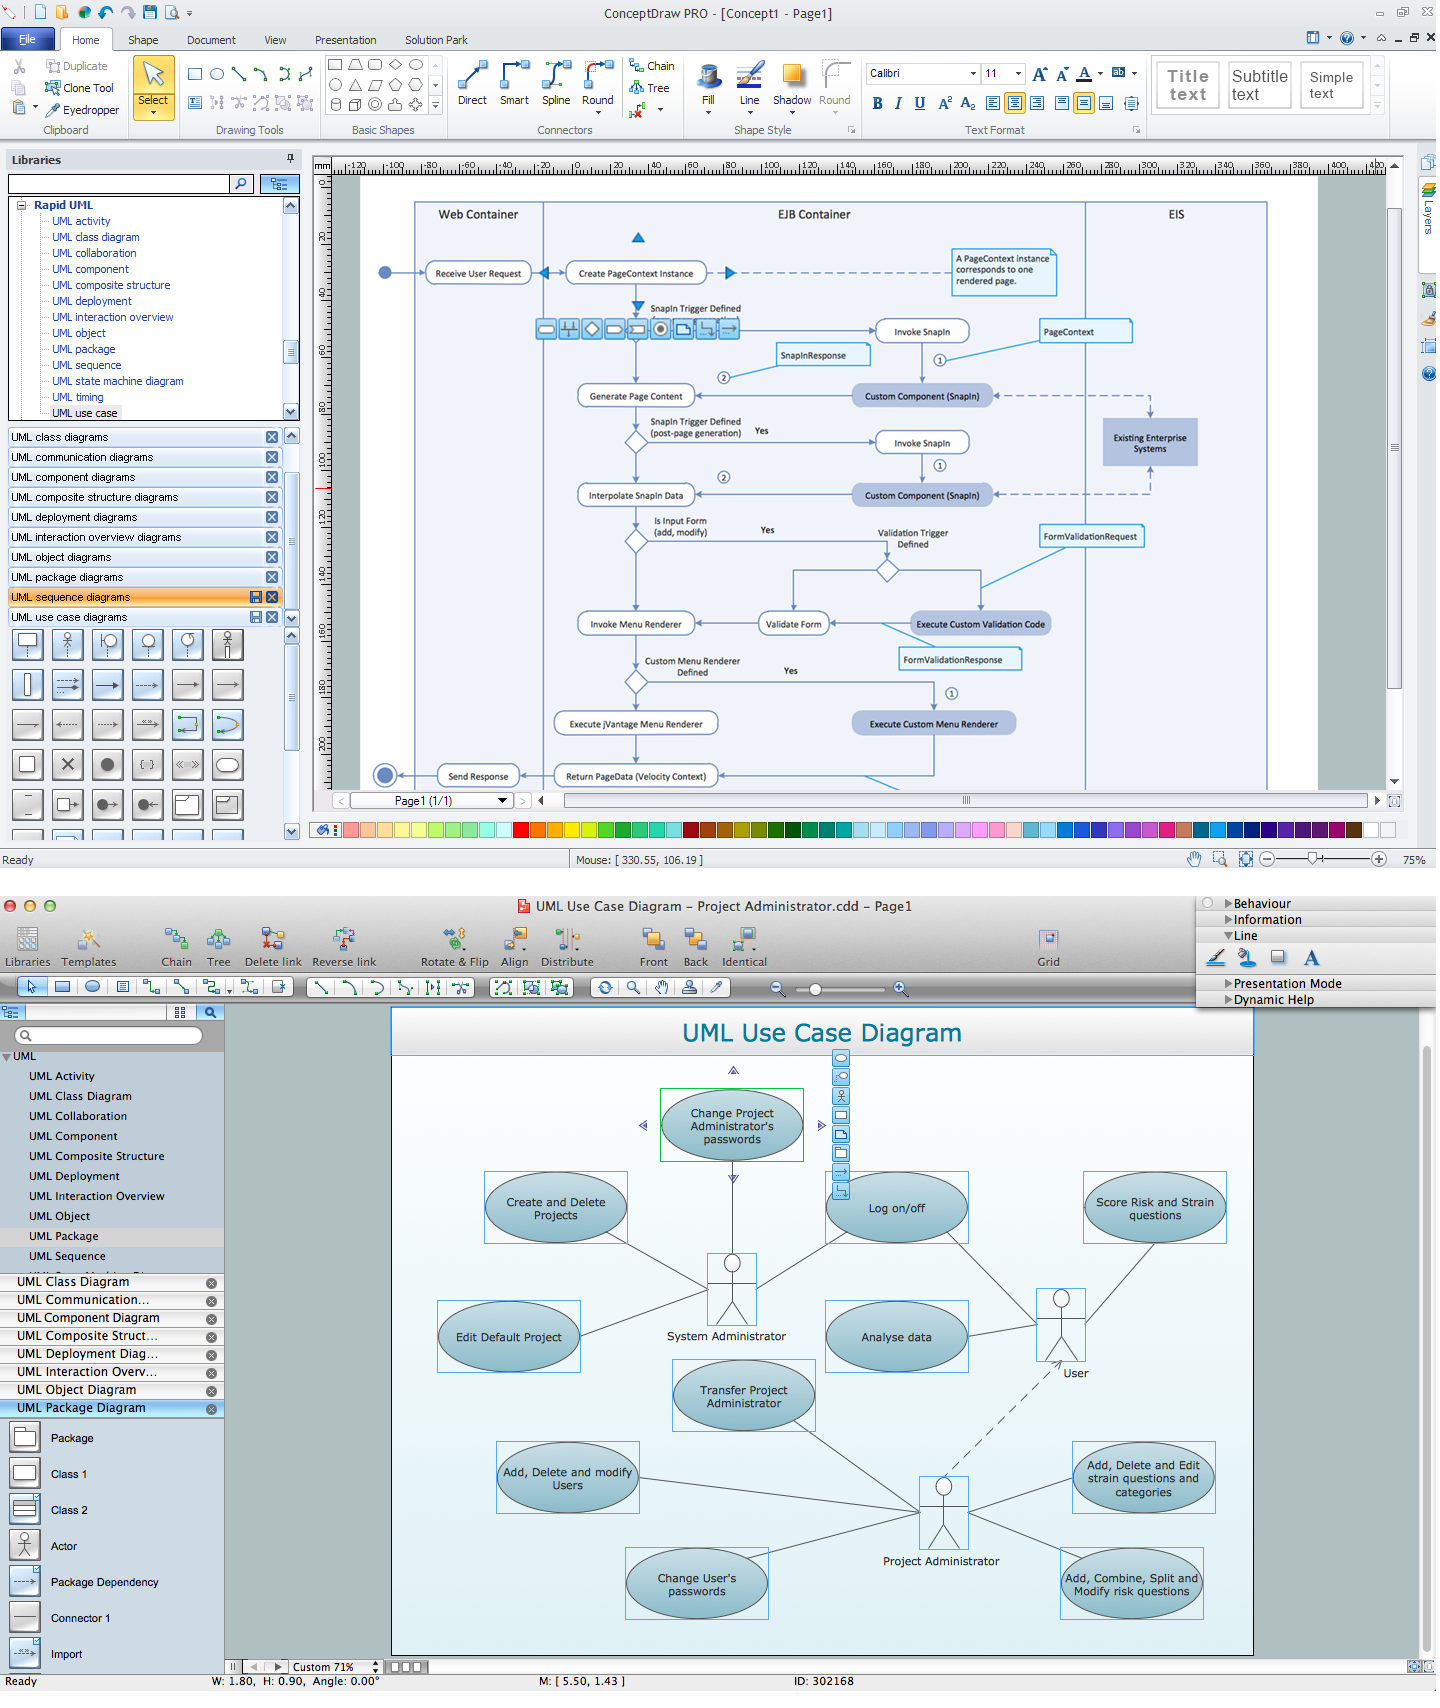
 Rapid UML
Rapid UML solution extends ConceptDraw DIAGRAM software with templates, samples and libraries of vector stencils for quick drawing the UML diagrams using Rapid Draw technology.
 Word Exchange
This solution extends ConceptDraw MINDMAP software with the ability to quickly create the framework for a future article or book, fill the structure with ideas, and use it to produce an MS Word document with just a simple click of the mouse.
 Wireless Networks
The Wireless Networks Solution extends ConceptDraw DIAGRAM software with professional diagramming tools, set of wireless network diagram templates and samples, comprehensive library of wireless communications and WLAN objects to help network engineers and designers efficiently design and create Wireless network diagrams that illustrate wireless networks of any speed and complexity, and help to identify all required equipment for construction and updating wireless networks, and calculating their costs.
Biology Illustration
- Image Flow Chart On Evolution
- Pictures Of Flow Chart Depicting Different Means Of Transport
- A Flowchart Depicting Development In The Field Of Transportation
- Evolution of the population | Line Chart Examples | Line Graph ...
- Transport Chart Images
- Diagrams Showing Forms Of Transport
- Mix Transportation Pictures Clipart
- Bus Transport System For Circuit Diagram
- Data Flow Diagram Process | Mind Mapping in the Quality ...
- Basic Flowchart Symbols and Meaning | Cross Functional Flowchart ...
- UML Class Diagram Example for Transport System | Design ...
- 4 Level pyramid model diagram - Information systems types ...
- Sales Process Flowchart . Flowchart Examples | Circular Diagram ...
- 3d Chart Transport
- Transport map - Template | How to draw Metro Map style ...
- Rail transport - Design elements | UML Deployment Diagram ...
- Intelligent transportation system | Transportation Infographics | Road ...
- Road Transport - Design Elements | Aerospace and Transport | Map ...
- Aerospace and Transport | Fishbone Diagram | Spider Chart ...
- Illustrator Flowchart Template Free