HR flowchart "UK Labour Market Categories" was redesigned from the Wikipedia file: UK Labour Market Categories.png.
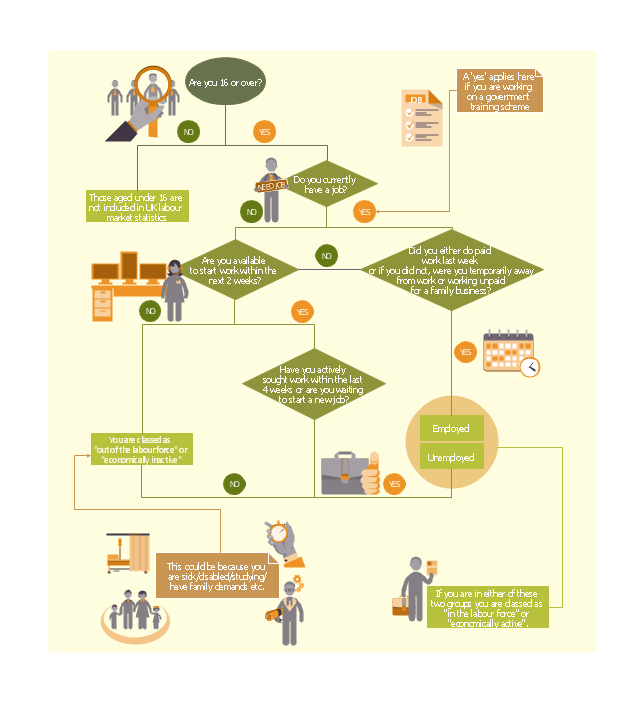
"Flow chart showing the different categories in the UK labour market such as employed, unemployed and economically inactive." [commons.wikimedia.org/ wiki/ File:UK_ Labour_ Market_ Categories.png]
This file is licensed under the Creative Commons Attribution-Share Alike 3.0 Unported license. [creativecommons.org/ licenses/ by-sa/ 3.0/ ]
"Employment is a relationship between two parties, usually based on a contract, one being the employer and the other being the employee. ...
An employee contributes labor and expertise to an endeavor of an employer and is usually hired to perform specific duties which are packaged into a job. An Employee is a person who is hired to provide services to a company on a regular basis in exchange for compensation and who does not provide these services as part of an independent business. ...
Employer and managerial control within an organization rests at many levels and has important implications for staff and productivity alike, with control forming the fundamental link between desired outcomes and actual processes. Employers must balance interests such as decreasing wage constraints with a maximization of labor productivity in order to achieve a profitable and productive employment relationship." [Employment. Wikipedia]
The HR flow chart example "UK labour market categories" was created using the ConceptDraw PRO diagramming and vector drawing software extended with the HR Flowcharts solution from the Management area of ConceptDraw Solution Park.
HR flowchart
Competitor Analysis

 Marketing Diagrams
Marketing Diagrams solution extends ConceptDraw DIAGRAM diagramming software with abundance of samples, templates and vector design elements intended for easy graphical visualization and drawing different types of Marketing diagrams and graphs, including Branding Strategies Diagram, Five Forces Model Diagram, Decision Tree Diagram, Puzzle Diagram, Step Diagram, Process Chart, Strategy Map, Funnel Diagram, Value Chain Diagram, Ladder of Customer Loyalty Diagram, Leaky Bucket Diagram, Promotional Mix Diagram, Service-Goods Continuum Diagram, Six Markets Model Diagram, Sources of Customer Satisfaction Diagram, etc. Analyze effectively the marketing activity of your company and apply the optimal marketing methods with ConceptDraw DIAGRAM software.
Work Order Process Flowchart. Business Process Mapping Examples

Flowchart on Bank. Flowchart Examples


Types of Flowchart - Overview


Fishbone Diagram Procedure

Six Markets Model Chart

Pyramid Diagram

 HR Flowcharts
Human resource management diagrams show recruitment models, the hiring process and human resource development of human resources.
- Flow Chart On Different Markets
- Types of Flowcharts | Flowchart Marketing Process . Flowchart ...
- Types Of Matrix In Marketing
- UK labour market categories | How to Draw a Pie Chart Using ...
- How to Draw an Organization Chart | Marketing and Sales ...
- UK labour market categories | Employee distribution - HR ...
- Market Demand By Flowchart
- Category Product Marketing
- Data Flow Diagram (DFD) | Flowchart Marketing Process . Flowchart ...
- UK labour market categories | | HR workflow - Vector stencils library ...