This site uses cookies. By continuing to browse the ConceptDraw site you are agreeing to our Use of Site Cookies.

Flowchart Components

The ConceptDraw Flowchart component includes a set of samples and templates. This geathered as flowchart maker toolbox which focused on drawing flowcharts of any industry standards.

Business Diagram Software

ConceptDraw business diagram Software is the most powerful business and relational charting software. Create advanced, completely customizable flow charts, organizational charts, business process diagrams, work flow diagrams, audit diagram, value stream maps, TQM diagrams, ERD diagrams, EPC diagrams, marketing diagrams, cause and effect diagrams, dashboards, infographics and other relational business diagrams from your data.
Business Process Modeling

Biology Symbols

ConceptDraw DIAGRAM diagramming and vector drawing software extended with Biology solution from the Science and Education area offers a set of useful tools for fast and easy drawing of various biology illustrations and drawings.

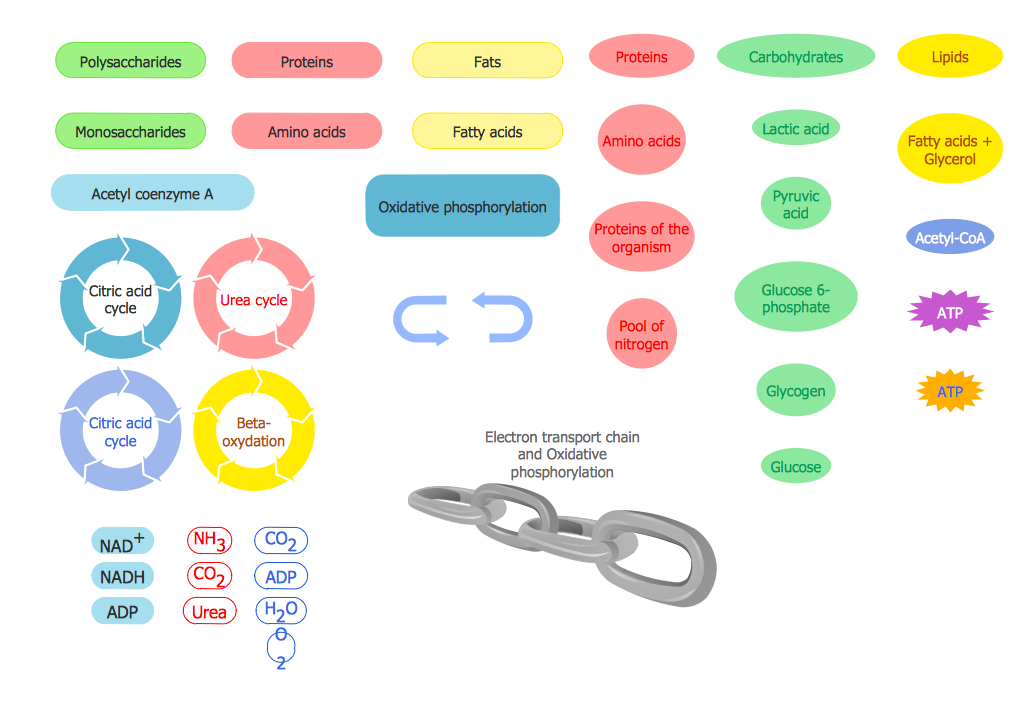
Biology solution provides 3 libraries with large quantity of vector biology symbols: Biochemistry of Metabolism Library, Carbohydrate Metabolism Library, Citric Acid Cycle (TCA Cycle) Library.

Visual Presentations Made Easy with Diagramming Software

Automatically create a presentation-quality diagram in one click with ConceptDraw DIAGRAM.

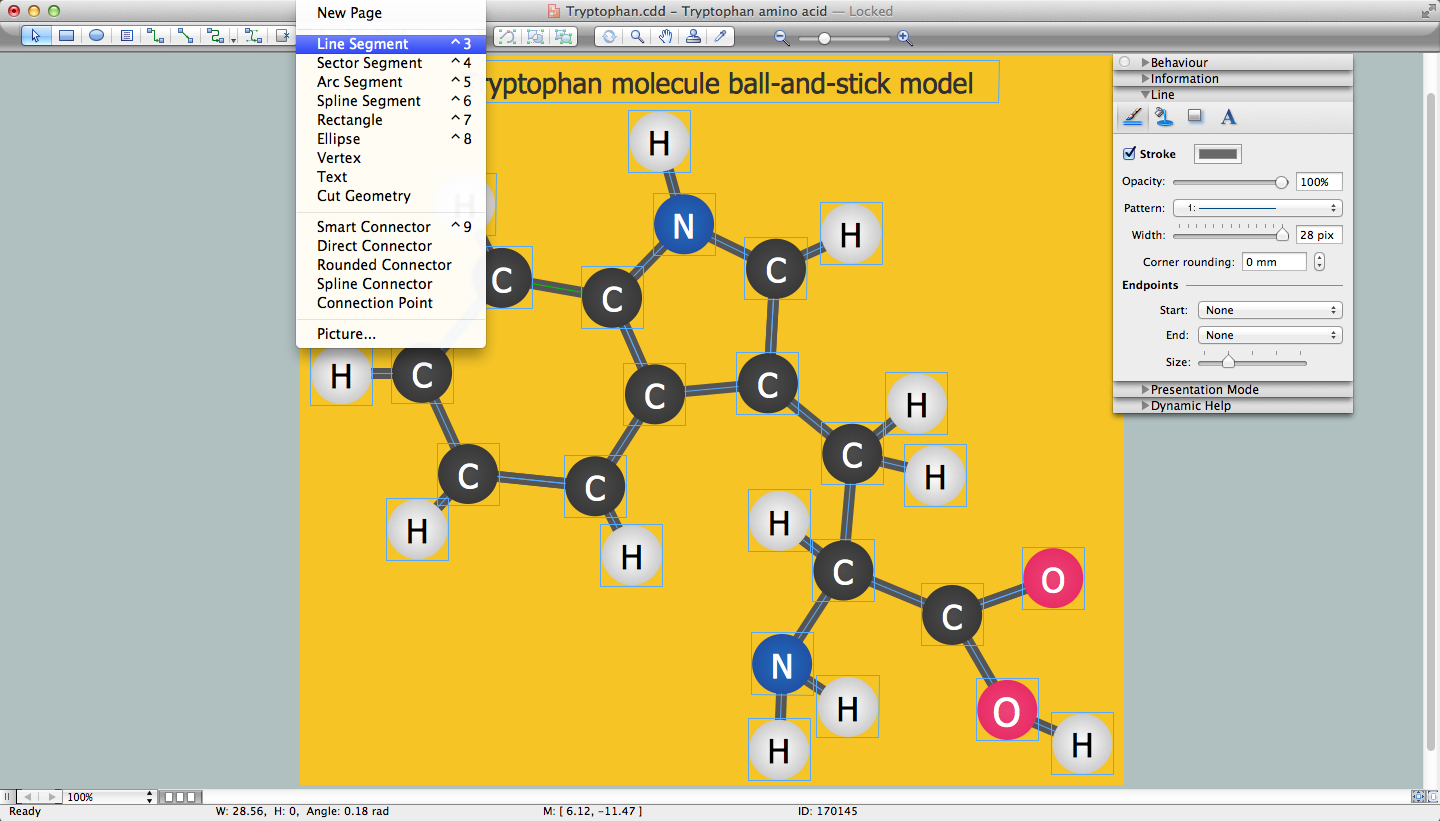
Chemistry Drawing Software

ConceptDraw DIAGRAM extended with Chemistry solution from the Science and Education area is a powerful chemistry drawing software that provides the useful tools to help you design all kinds of chemistry drawings and illustrations, chemical schemes and diagrams of formulas, reaction schemes and lab set-ups of any complexity.

draw area chart, draw area graph Area Charts

draw area chart, draw area graph
Area Charts are used to display the cumulative totals over time using numbers or percentages; or to show trends over time among related attributes. The Area Chart is effective when comparing two or more quantities. Each series of data is typically represented with a different color, the use of color transparency in an object’s transparency shows overlapped areas and smaller areas hidden behind larger areas.

Educational Technology Tools

What are the favorite educational technology tools and techniques for teachers? Of course these are pictures, images and education infographics! ConceptDraw DIAGRAM software supplied with Education Infographics Solution from the Business Infographics Area provides powerful drawing tools to help design the education infographics of any complexity.

How can you illustrate the weather condition

Use it to make professional looking documents, presentations, and websites illustrated with color scalable vector clipart for geography, weather, and animals.

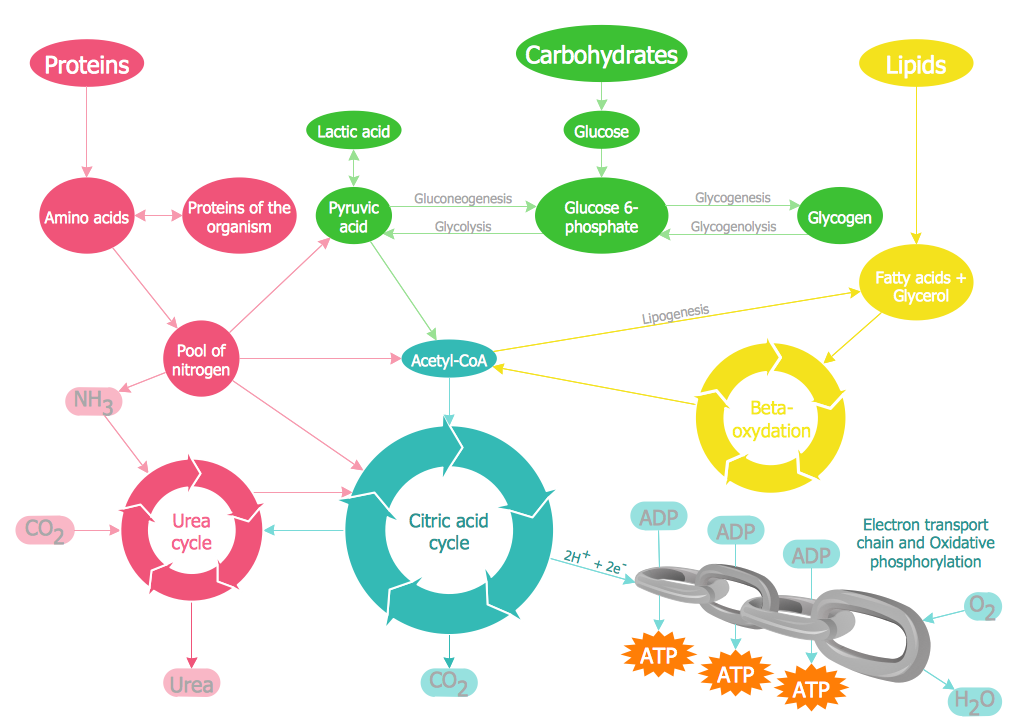
Biology Illustration

Biology solution offers 3 libraries of ready-to-use predesigned biology symbols and vector clipart to make your biology drawing and biology illustration making fast and easy: Carbohydrate Metabolism Library, Biochemistry of Metabolism Library, Citric Acid Cycle (TCA Cycle) Library.