Using Fishbone Diagrams for Problem Solving

Fishbone Diagram Problem Solving

Fishbone Diagram Design Element
.png)
HelpDesk
How To Convert a Fishbone Diagram to Adobe PDF

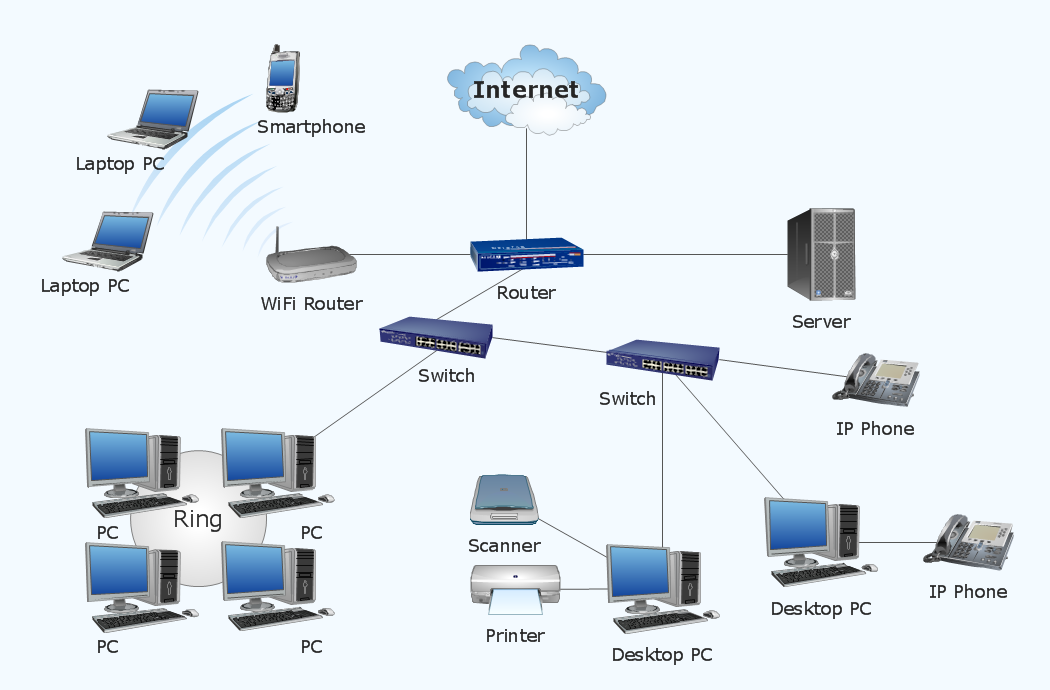
 Cisco Network Diagrams
Cisco Network Diagrams solution extends ConceptDraw DIAGRAM with the best characteristics of network diagramming software. Included samples, templates and libraries of built-in standardized vector Cisco network icons and Cisco symbols of computers, network devices, network appliances and other Cisco network equipment will help network engineers, network designers, network and system administrators, as well as other IT professionals and corporate IT departments to diagram efficiently the network infrastructure, to visualize computer networks topologies, to design Cisco computer networks, and to create professional-looking Cisco Computer network diagrams, Cisco network designs and schematics, Network maps, and Network topology diagrams in minutes.
How to Create Network Diagrams
Troubleshooting in Wireless Connection
Cause and Effect Diagrams

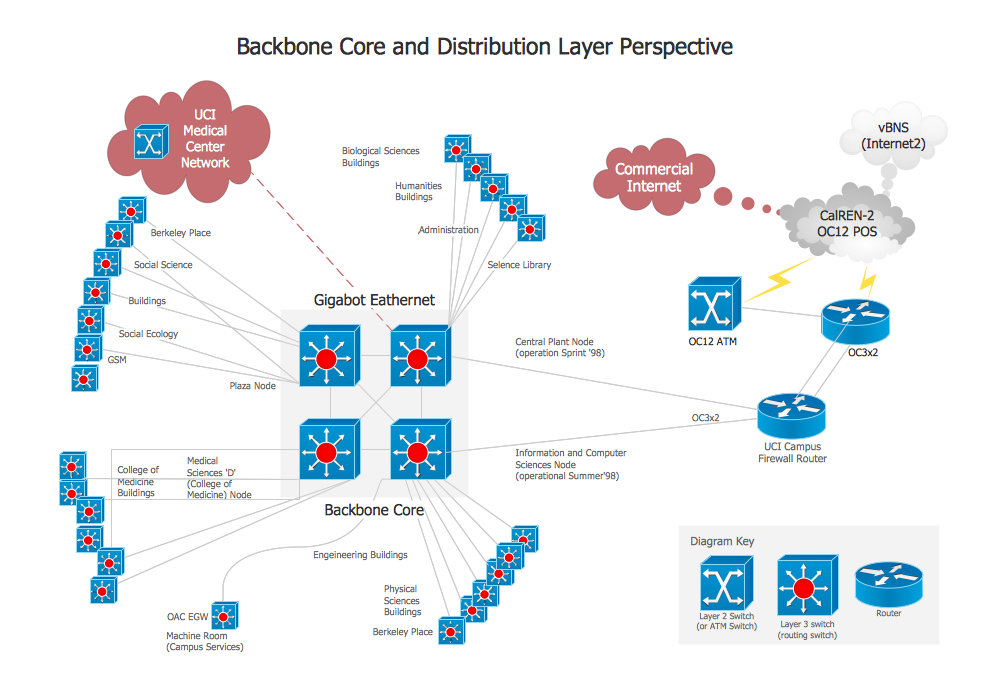
Network Diagram Software Backbone Network

When To Use a Fishbone Diagram

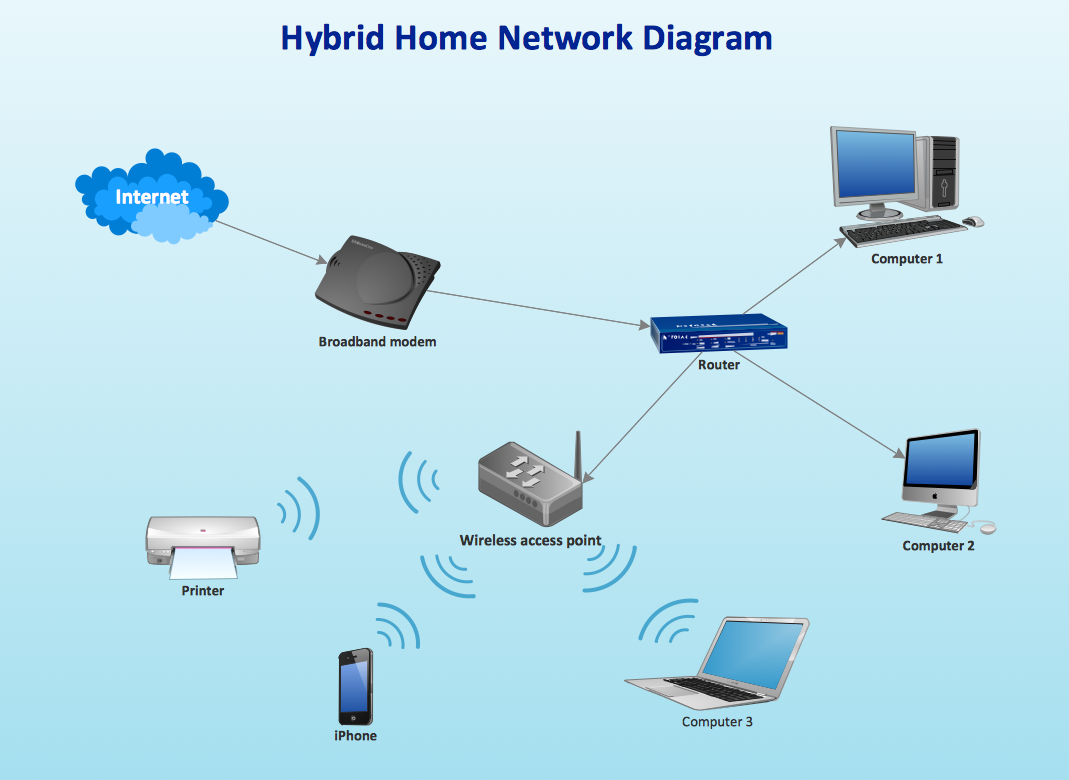
- Fishbone diagram - HAN project | Home wireless network diagram ...
- GPS operation diagram | UML Class Diagram Notation | Basic ...
- Cafe and Restaurant Floor Plans | Fishbone Diagrams | Value ...
- Fishbone Diagrams | Network Diagram Software (PRO) | AWS ...
- Process Flowchart | 4 Ms fishbone diagram - Production process ...
- Fishbone Diagrams | AWS Architecture Diagrams | Network Diagram ...
- Design elements - Aircraft | Fishbone Diagram | Computer and ...
- Cafe and Restaurant Floor Plans | Fishbone Diagrams | Value ...
- Fishbone Diagrams | How Do Fishbone Diagrams Solve ...
- Manufacturing 8 Ms fishbone diagram - Template | Management ...