 Fishbone Diagrams
The Fishbone Diagrams solution extends ConceptDraw DIAGRAM software with the ability to easily draw the Fishbone Diagrams (Ishikawa Diagrams) to clearly see the cause and effect analysis and also problem solving. The vector graphic diagrams produced using this solution can be used in whitepapers, presentations, datasheets, posters, and published technical material.
Using Fishbone Diagrams for Problem Solving

Fishbone Diagram
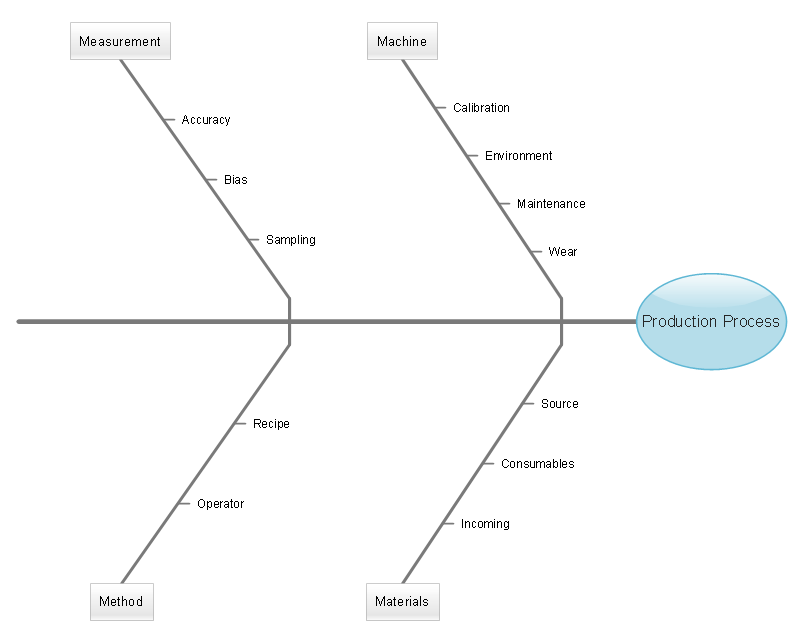
Fishbone Problem Solving

Seven Basic Tools of Quality — Quality Control

 Fault Tree Analysis Diagrams
This solution extends ConceptDraw DIAGRAM.5 or later with templates, fault tree analysis example, samples and a library of vector design elements for drawing FTA diagrams (or negative analytical trees), cause and effect diagrams and fault tree diagrams.
Business Productivity - Management

 Social Media Response
This solution extends ConceptDraw DIAGRAM and ConceptDraw MINDMAP with the ability to draw interactive flow charts with action mind map templates, to help create an effective response to applicable social media mentions.
Business Diagram Software


 Seven Basic Tools of Quality
Manage quality control in the workplace, using fishbone diagrams, flowcharts, Pareto charts and histograms, provided by the Seven Basic Tools of Quality solution.
- Fish Bone Diagram About Social Service
- Fishbone Diagrams | Fishbone diagram - Bad coffee | Social Media ...
- Fish Bone Analysis For Customer Complaints
- UML Use Case Diagram Example Social Networking Sites Project ...
- SWOT Analysis | Language Learning | Social Media Response ...
- Fishbone Diagram About Problem Using Social Media
- Cause and Effect Analysis - Fishbone Diagrams for Problem Solving ...
- Rapid UML | Fishbone Diagrams | Social Media Response | Value ...
- Competitor Analysis | Circle-Spoke Diagrams | Fishbone Diagrams ...
- Venn Diagram Examples for Problem Solving. Environmental Social ...